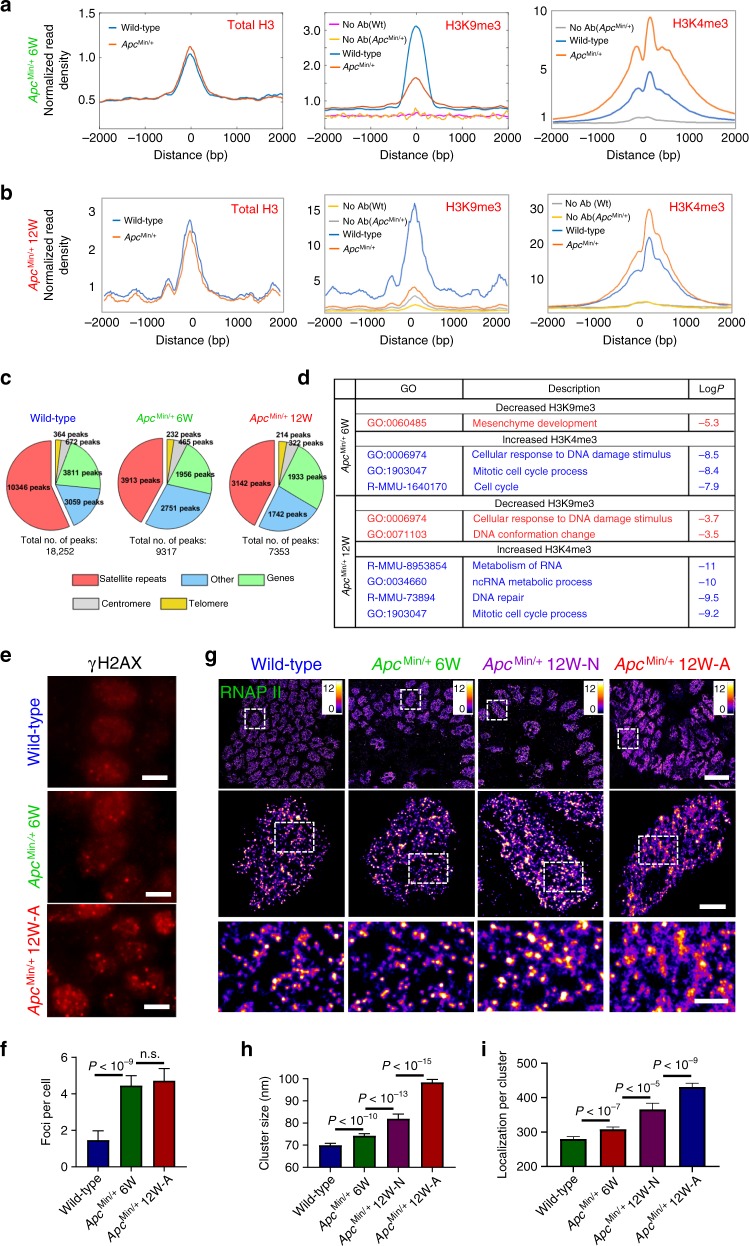
Fig. 3. Impact of disrupted chromatin structure on transcription and genomic stability.
a, b Average enrichment of H3K9me3 and total H3 from previously described H3K9me3 enriched genomic regions and average H3K4me3 occupancy over transcription start sites (TSSs), and c pie charts that show the genomic distribution of peaks that were enriched by H3K9me3, from normal-appearing intestinal tissue from wild-type mice and age-matched ApcMin/+ mice at 6 and 12 weeks, respectively. The genomic distribution in the pie chart consists of satellite repeats, genes, centromere, telomere and other genomic regions (including intergenic, other repeat regions that are unassigned to a type of repeat and non-annotated regions of the genome). d Gene ontology (GO) analysis for overlapping upregulated genes with reduced occupancy of H3K9me3 and increased occupancy of H3K4me3 of 6- and 12-week ApcMin/+ mice compared to age-matched wild-type mice. e γH2AX immunofluorescence staining in wild-type mice, ApcMin/+ mice at 6 and 12 weeks. Scale bars: 5 µm. f The number of γH2AX foci for each group (n = 50, 31, 28 cells, respectively). g The STORM images of active RNAP II from normal cells from wild-type, histologically normal-appearing cells from 6- and 12-week ApcMin/+ and tumor cells from 12-week ApcMin/+ mice. Scale bars: 10 µm, 2 µm and 500 nm in the original and magnified images, respectively. h, i Statistical analysis of the active RNAPII cluster size and number of localizations per cluster for each group (n = 301, 333, 174 and 321 cells, respectively). Cell nuclei from three mice were analyzed for each group, similar as described in Fig. 1. Error bars: mean ± 95% CI. All P values were determined using Mann−Whitney test.

