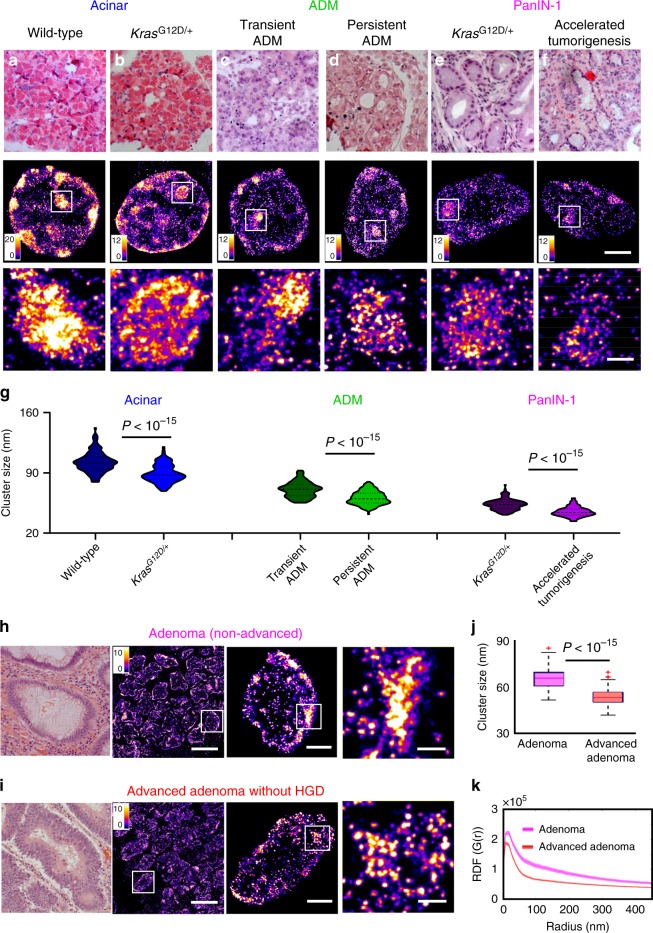
Fig. 7. Disrupted heterochromatin structure in precursors indistinguishable by conventional pathology.
a–f Representative histology and super-resolution images of heterochromatin structure in normal acinar cells between wild-type mice and KrasG12D/+ mice, between transient ADM from wild-type mice treated with cerulein and persistent ADM from KrasG12D/+ mice treated with cerulein, PanIN-1 lesions from KrasG12D/+ mice and KrasG12D/+ mice with cerulein treatment that underwent accelerated tumorigenesis. Scale bars in STORM images are 2 µm and 500 nm in the original and magnified images, respectively. g Statistical analysis of the H3K9me3 cluster size for each group. Acinar cell from wild-type (n = 115 cells) and KrasG12D/+ (n = 103 cells), transient ADM (n = 103 cells) and persistent ADM (n = 145 cells), KrasG12D/+ (n = 133 cells) and accelerated tumorigenesis (n = 101 cells). Data are presented as violin plots. h, i Representative histology and corresponding super-resolution images of heterochromatin structure between non-advanced adenoma and advanced adenoma without high-grade dysplasia. Note that adenoma and advanced adenoma without HGD are histologically indistinguishable, and advanced adenoma without HGD refers to those large adenoma with a tumor size of more than 1 cm (1.5 cm polyps). Scale bars in STORM images are 10 µm, 2 µm and 500 nm in the original and magnified images, respectively. j The box-and-whisker plots of the cluster size of H3K9me3-dependent heterochromatin (n = 105 and 154 cells, respectively). k The average radial distribution function (RDF) for H3K9me3, where the solid curve shows the average value from all measured nuclei and the shaded area shows the standard error. The P value between non-advanced adenoma and advanced adenoma without HGD is P < 10−15. P values were determined using Mann−Whitney test.

