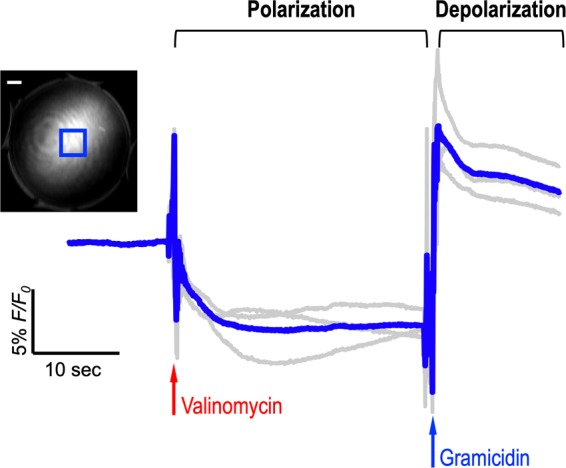
Figure 3.

Temporal characterization of VSD response using lipid vesicle membrane model. Gray data indicate individual FL trace measurements. Each trace was normalized with the FL intensity before the administration of valinomycin. Initial signal fluctuations in polarization and depolarization phases are due to the administration of valinomycin and gramicidin. Blue rectangular in the exemplary FL image indicates region-of-interest, and white bar shows 1 mm. Gray lines were from three trials. Note that the FL contrast change obtained from the setup would be different from our previous study with a calibrated spectrofluorometry18,19, as only partial depth in a droplet would react to the ionophores manually administrated with pipette.
