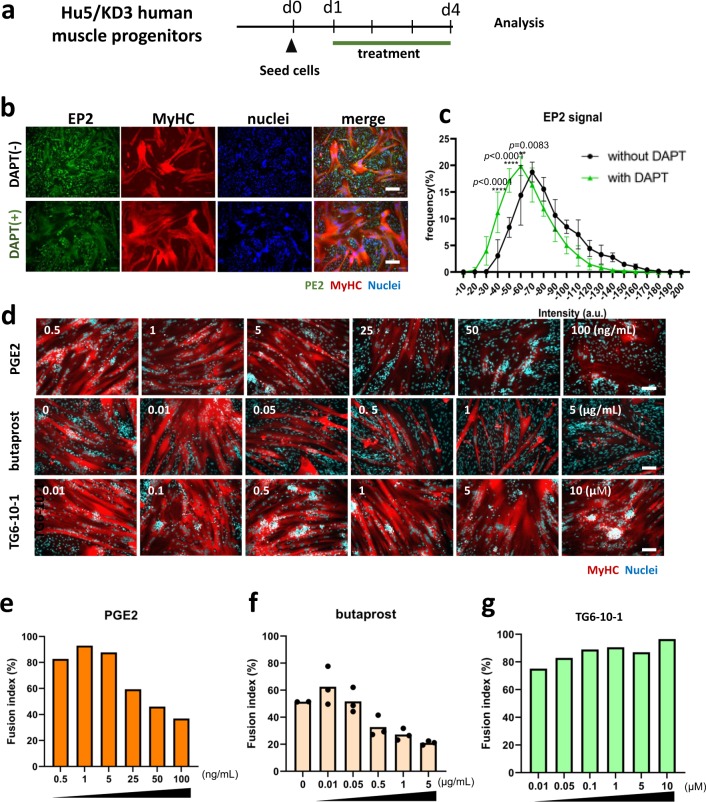
Fig. 5. Effects of prostaglandin E2 (PGE2), EP2 agonist (butaprost), EP2 antagonist (TG6-10-1), and overexpression and knockdown of EP2 on myotube formation of a human myoblast cell line, Hu5/KD3 cells.
a Experimental design. Hu5/KD3 cells were seeded onto collagen type I-coated 12-well plates (5 × 10⁵ cells/well) and cultured in 10% FBS/DMEM medium with prostaglandin E2 (0.5–100 ng/ml), butaprost (EP2 agonist) (0.01–5 µg/ml), or PE2 antagonist, TG6-10-1 (0.01–10 µM) for 3 days. b Expressions of EP2 (green) and MyHC (MF20, red) on differentiating Hu/KD3 cells w/o DAPT treatment. Scale bar, 100 μm. c Histogram of EP2 signal of mononuclear cells treated with (green) or without (black) DAPT. Y-axis indicates the frequency. Data are shown as mean ± S.D. and analyzed by two-way ANOVA followed by Sidak’s multiple comparisons test. More than 600 cells in each group were measured (n = 3 samples/group). d Representative MyHC staining of differentiating Hu5/KD3 cells treated with PGE2, butaprost, or TG6-10-1 at indicated concentrations. Scale bar, 100 μm. e Fusion index of Hu5/KD3 cells after treatment with PGE2. f Fusion index of Hu5/KD3 cells after treatment with butaprost. g Fusion index of Hu5/KD3 cells after treatment with TG6-10-1.

