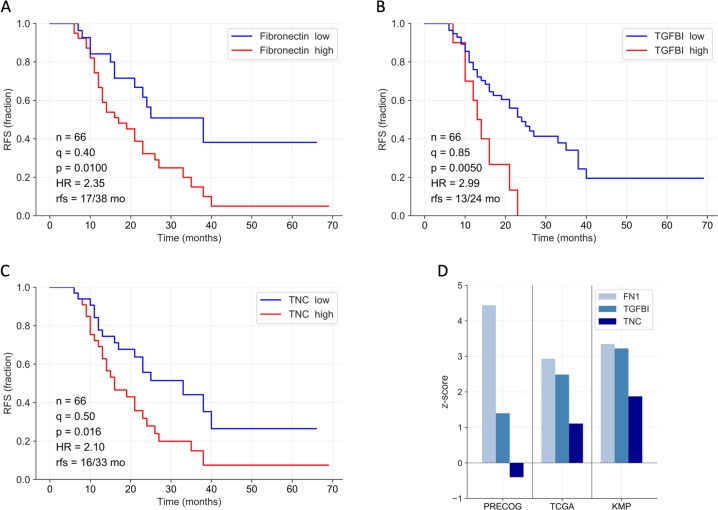
Fig. 4. Association of TGFBI, TNC, and FN1 ascites levels with ovarian cancer survival.
a–c Kaplan–Meier plots showing the relationship between relapse-free survival (RFS) and SOMAscan protein signals for fibronectin (a), TGFBI (b), and TNC (c) in cell-free ascites from HGSC patients. n: number of evaluable patients; q quantile used for splitting datasets (high versus low levels), p logrank p value, HR hazard ratio, rfs median RFS (months). d Mean z-scores for survival associations with TGFBI, TNC, and FN1 gene expression in solid tissue from ovarian carcinoma) based on public datasets. TCGA34 and KMP35: relapse-free survival (RFS); PRECOG36: overall survival (OS). Positive and negative z-scores indicate HR > 1 and HR < 1, respectively. A z-score of 1.96 corresponds to a logrank p value of 0.05.

