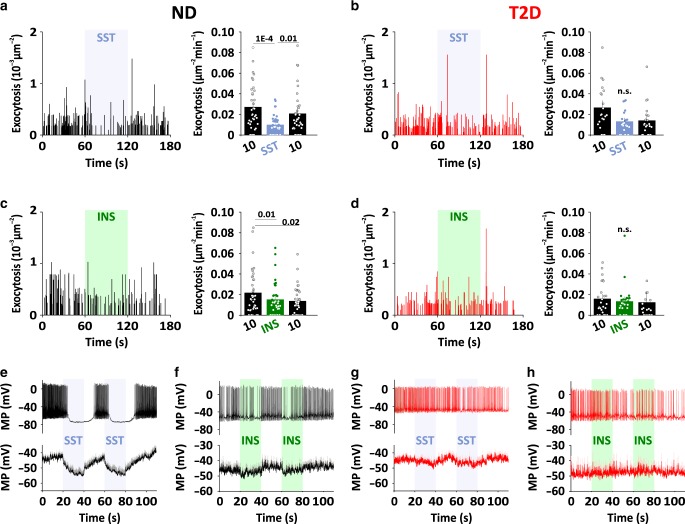
Fig. 6. Time course of paracrine inhibition in dispersed α-cells.
a Time course of spontaneous exocytosis for a representative ND α-cell bathed in 10 mM glucose (black) and challenged with somatostatin during the indicated interval (SST, 400 nM; left, blue bar). Bars to the right show quantification of average exocytosis during the three time periods of the experiment (36 cells/6 donors). Data are presented as mean values ±SEM. In a–d, significant differences are indicated with p-values (one-way ANOVA, Fisher posthoc test). b As in a, but for T2D α-cells (38 cells/6 donors). c, d As in b–e, but challenged with insulin (INS, 100 nM, green bar). 21 cells/4 ND donors and 25 cells/3 T2D donors. e, f Example (upper) and average (lower) membrane potential recording in dispersed ND α-cells bathed in 10 mM glucose. Somatostatin (SST, 400 nM, 17 cells/4 donors, blue shading in e) or insulin (INS, 100 nM, 25 cells/6 donors, green shading in f) were applied during the indicated time interval. g, h as in e, f, but for dispersed T2D α-cells (11 cells/2 donors in G; 13 cells/4 donors in h).

