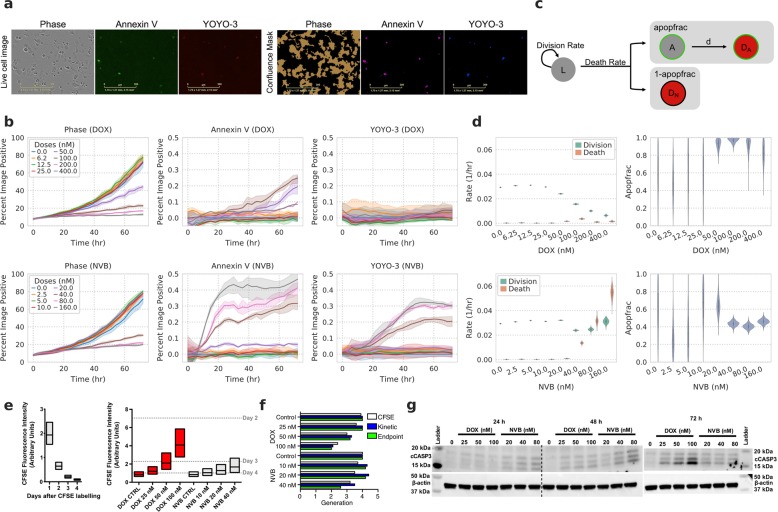
Fig. 2. High-throughput measurements of cell death accurately quantify compound response.
a Representative images from live-cell imaging and processing. Scale bar indicates 300 μm. b Experimental measurements of doxorubicin (DOX, top) and vinorelbine (NVB, bottom) response in H1299 cells over time. Phase indicates total cell confluence. Each line represents the mean of triplicate measurements for individual drug dose over time, and shaded areas show the ranges of measurements. c Schematic of the cell growth-death model. The live (L) cells grow at the rate of division (div), and die at the rate of death (deathRate). The model considers two fractions of cells in cell death: cells dying through apoptosis (apopfrac) and other modes (1–apopfrac). Cells in early apoptosis (A) proceed into late apoptosis (DA) by losing membrane integrity at rate d. d The model predicted div, deathRate, and apopfrac from the data represented in (b). Violins show posterior of model after fitting. e Cell division analysis of CFSE-labeled H1299 cells by flow cytometry. The distribution of cells according to CFSE fluorescence intensity on indicated days for untreated cells (left) or after indicated treatments (right) for 72 h are shown in boxplots with median, lower, and upper quartiles. Median CFSE intensities of 2–4 days post-CFSE labeling in left graph are marked as dashed lines on the right graph. f The number of generations for indicated conditions calculated by median fluorescence intensities from CFSE-based assay and model-predicted cell growth rates from kinetic and end-point measurements. g Western blot of cleaved-caspase-3 (cCASP3) after treating H1299 cells with indicated drug doses for 24, 48, and 72 h.

