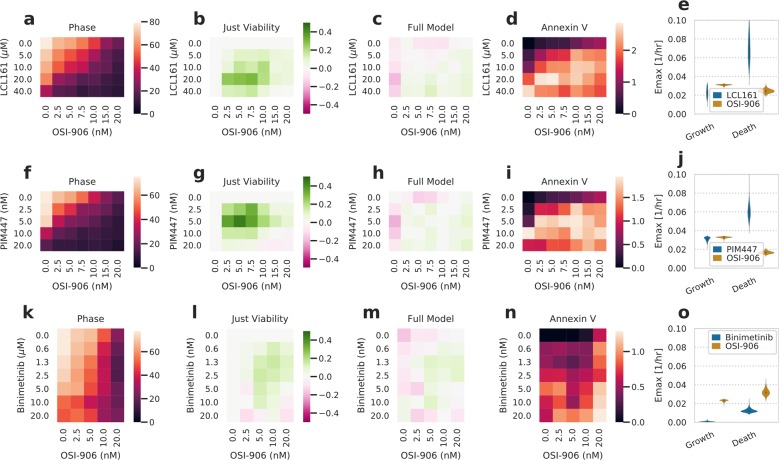
Fig. 4. Additive interactions can appear synergistic when only assessed by viability.
a, f, k Heatmap of percent confluence for combinations of LCL161 (a), PIM447 (f), or binimetinib (k) with OSI-906 at 72 h. Color scale indicates percent confluence. b, g, l Heatmap of deviation from Bliss additivity for measurements in a, f, k. Color scale indicates deviation from additive prediction on a scale of 0–1. c, h, m Heatmap of deviation from the additive model incorporating both growth and death processes for phase measurements. Color scale indicates deviation from additive prediction on a scale of 0–1, where positive and negative values indicate drug synergy and antagonism, respectively. d, i, n Heatmap of percent image area positive for Annexin V signal at 72 h. e, j, o Fit growth and death rate Emax for each drug. Fits come from the additive interaction model incorporating both processes. The experimental measurements are shown in Supplementary Fig. S4.

