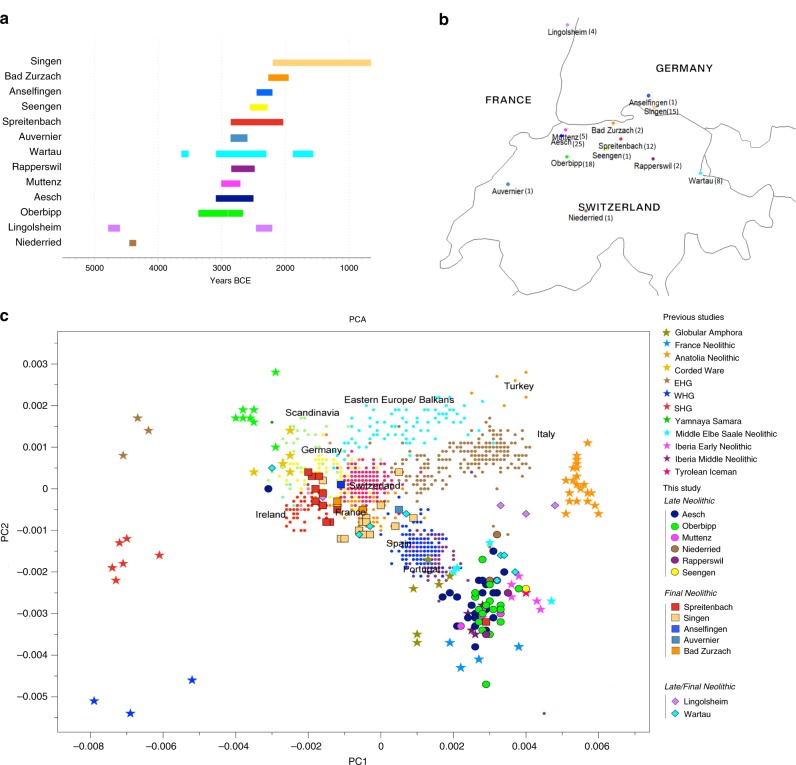
Fig. 1. Genetic, temporal, and spatial structure of individuals in this study.
a Time ranges of calibrated radiocarbon dates of the archaeological sites. b Geographical distribution of the sites and samples sizes per sites in brackets. Map generated with R version 3.4.3 (R Core Team 2017) using the CIA World Data Bank II currently (mid 2003) available from http://www.evl.uic.edu/pape/data/WDB/. c PCA was reconstructed on 1960 modern European individuals of the POPRES dataset and ancient genomes were projected onto it.

