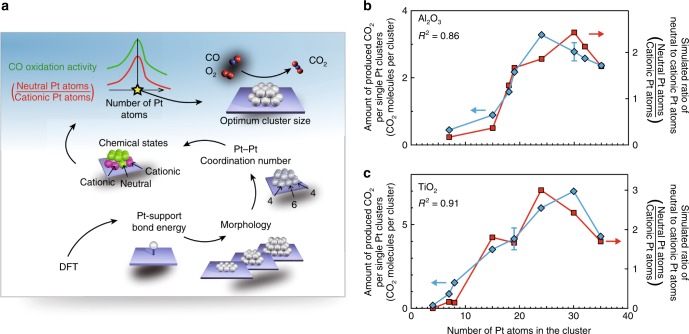
Fig. 5. Prediction of the optimum Pt cluster size for maximum CO oxidation activity.
a Schematic diagram illustrating the protocol used for optimum Pt cluster size prediction. The process starts with a theoretical calculation of the binding energy for a Pt monomer on the support material. b, c Comparison of the atomic ratios of neutral to cationic Pt atoms (red squares) with the amounts of CO2 produced for Ptn/Al2O3 (b) and Ptn/TiO2 (c) (blue diamonds). The error bars are standard deviation. Source data are provided as a Source Data file.

