
Figure 3.
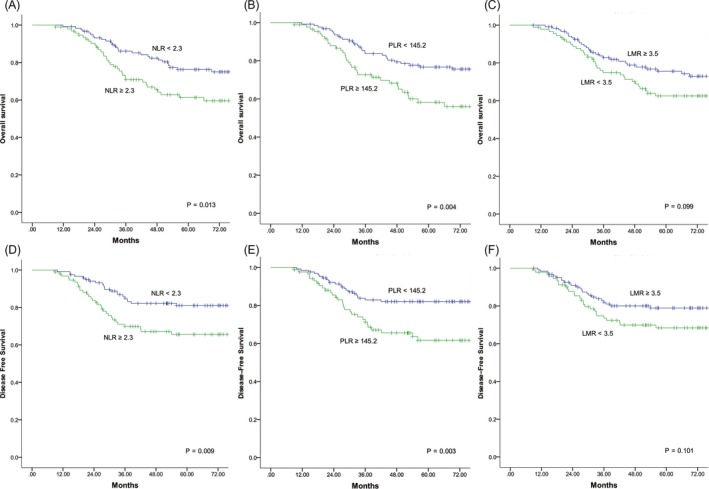
Kaplan‐Meier curves of overall survival (A, B, C) and disease‐free survival (D, E, F) for left‐sided colorectal cancer patients based on different levels of NLR, PLR, and LMR. NLR, neutrophil‐lymphocyte ratio; PLR, platelet‐lymphocyte ratio; LMR, lymphocyte‐monocyte ratio