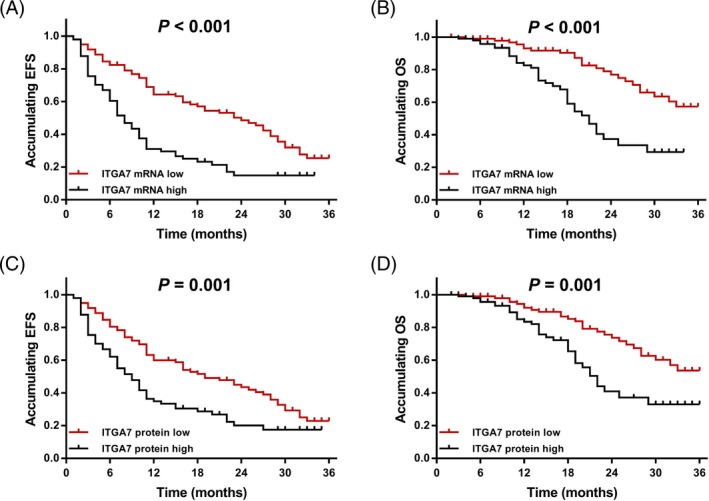
Figure 4.

The EFS and OS in AML patients. A, The correlation of ITGA7 mRNA expression with EFS in AML patients; B the correlation of ITGA7 mRNA expression with OS in AML patients; C, the correlation of ITGA7 protein expression with EFS in AML patients; and D, the correlation of ITGA7 protein expression with OS in AML patients. OS and EFS were illustrated by Kaplan‐Meier curve, and the difference of OS and EFS between groups was determined by the log‐rank test. P value <.05 was considered as significant. EFS, event‐free survival; OS, overall survival; ITGA7, integrin α7; AML, acute myeloid leukemia
