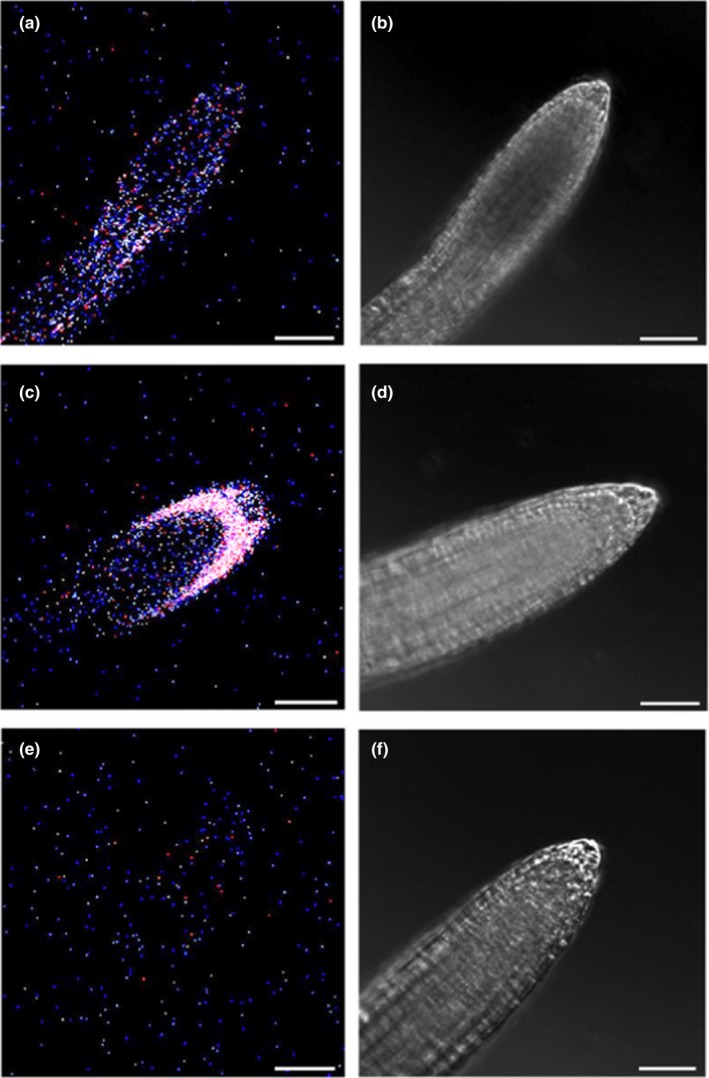
FIGURE 4.

Tissue expression of a GFP‐reporter protein expressed under control of a native EHB1 promoter. (a) GFP‐fluorescence of GFP expressed under control of a native EHB1 promoter (see methods for details). (c) For comparison, GFP fluorescence of EHB1‐GFP expressed under control of a 35S‐CaMV promoter and (e) autofluorescence of non‐transformed Col 0 were shown. (b,d,f) Corresponding phase‐contrast images. The detection window of the confocal microscope was set to 509 nm (±5 nm) to comprise the maximum peak of GFP fluorescence. Images of the native EHB1‐promoter construct revealed only a very low fluorescence at 509 nm compared with the strong and distinct GFP‐fluorescence of the 35S‐promoter construct. Although the native EHB1 promoter showed significantly more fluorescence at 509 nm than the wild‐type strain, confocal microscopic methods could not clearly distinguish GFP and residual autofluorescence in the native EHB1 promoter construct and were therefore not used for further analysis
