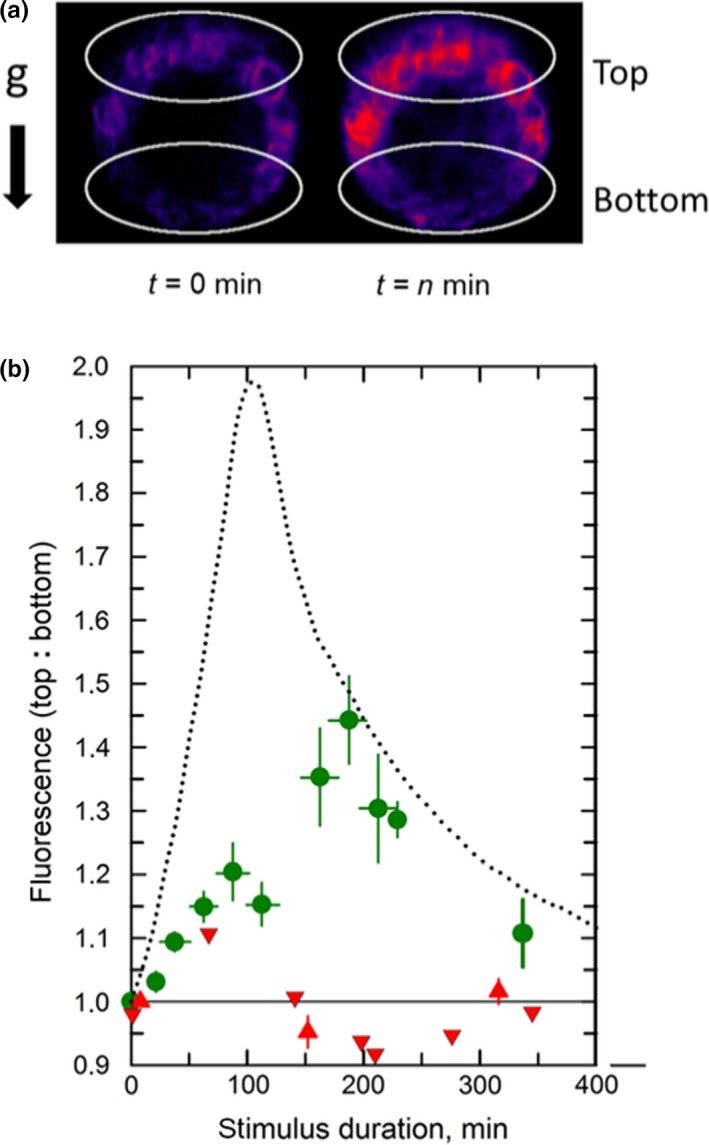
FIGURE 5.

Kinetics for the development of the EHB1‐GFP fluorescence asymmetry (Ftop vs. Fbottom) in gravitropically stimulated roots. (a) To quantify the fluorescence intensity, two regions of interest (white circles) were defined for which the fluorescence intensities were determined. (b) Prior reorientation (t = 0) end‐on images were taken 80 µm from the root apex of a vertically grown root and compared with an end‐on images obtained from gravitropic stimulated (horizontally orientated) roots. The ratio of both regions was plotted over time (green dots). Black‐dotted line: kinetics for the redistribution of endogenous IAA (redrawn from Band et al., 2012). Red upward‐pointing triangles: roots were treated omnilateral for 10 min prior t = 0 with 1 µM IAA, which remained present during stimulus durations. Red downward‐pointing triangles: Roots were treated for 10 min prior t = 0 with 10 µM NPA. Vertical errors bars: SE of 12–22 specimens. Horizontal error bars indicate the time intervals (SE) from which the data were binned
