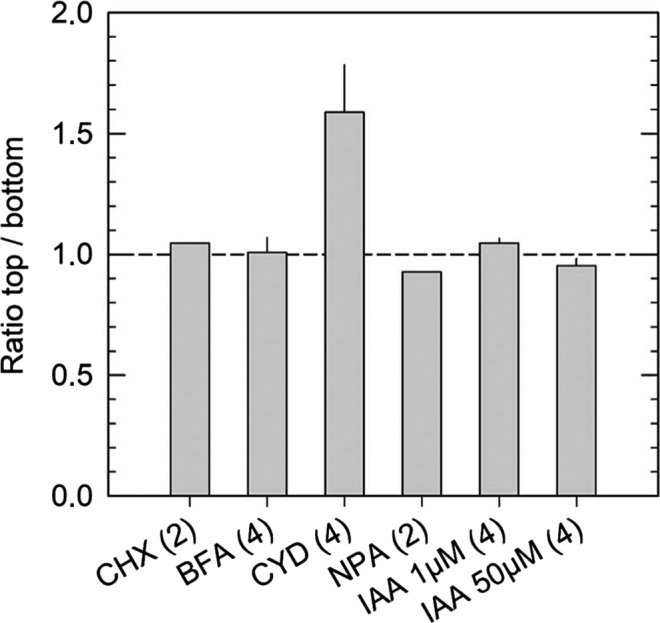
FIGURE 6.

Ratio of the fluorescence intensities of EHB1‐GFP in horizontally placed root tips that had been treated with the inhibitors shown in Figure 8. The two regions of interest, that is, ROI 1 at the top and ROI 2 at the bottom of the roots were as defined in Figure 5. Prior microscopy roots were unilaterally exposed for at least 1 hr to the various inhibitors (see Figures 8 and 9). Numbers of analyzed roots are given below the columns. BFA, brefeldin A; CHX, cycloheximide; CYD, cytochalasin D; IAA, Indole acetic acid; NPA, N‐1‐naphthylphthalamic acid. Mean values are given. Error bars, if any, indicate SE
