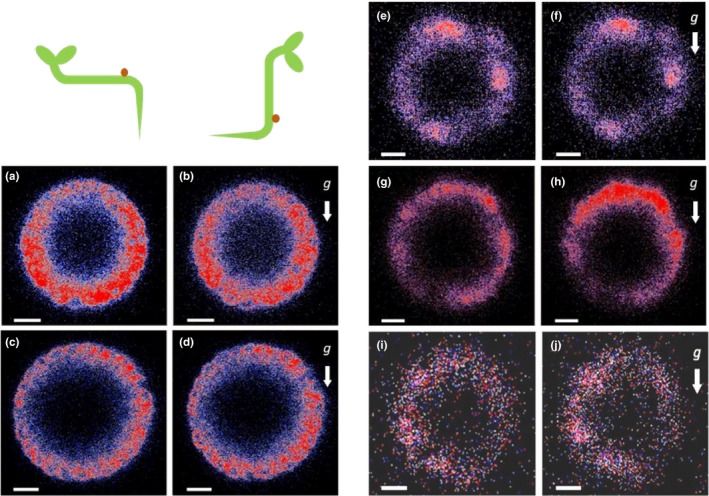
FIGURE 8.

Effect of various inhibitors on the differential fluorescence signals ofEHB1‐GFP in vertical and horizontal root caps. Optical cross‐sections obtained from end‐on visualization were taken at a depth of 80 µm. Scans of vertical roots treated with the inhibitors were taken (a, c, e, g, and i, respectively). Subsequently, roots were reoriented and kept for at least 60 min horizontally (b, d, f, h, j) before they were analyzed a second time. Prior microscopy vertical roots were unilaterally exposed for 1 hr to various inhibitors. (a,b) cycloheximide (CHX, 100 µM); (c,d) brefeldin A, (BFA, 10 µM), (e,f) N‐1‐naphthylphthalamic acid (NPA; 50 µM); (g,h) cytochalasin D (CYD, 10 µg/ml); (i,j) Indole acetic acid (IAA, 1 µM). g = gravitational acceleration. Scale bar = 15 µm
