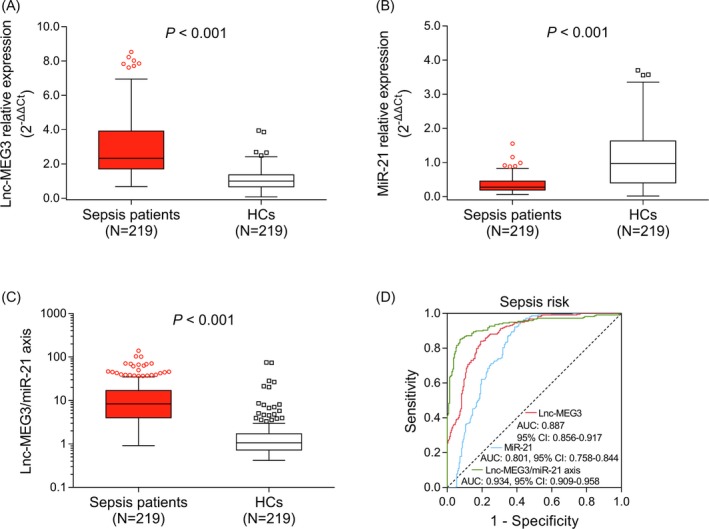
Figure 1.

The predictive values of lnc‐MEG3, miR‐21, and lnc‐MEG3/miR‐21 axis for sepsis risk. The comparisons of lnc‐MEG3 relative expression (A), miR‐21 relative expression (B), and lnc‐MEG3/miR‐21 axis (C) between sepsis patients and HCs. And the performances of lnc‐MEG3, miR‐21, and lnc‐MEG3/miR‐21 axis in predicting sepsis risk (D). The comparisons of lnc‐MEG3 relative expression, miR‐21 relative expression and lnc‐MEG3/miR‐21 axis between sepsis patients and HCs were assessed by Wilcoxon rank‐sum test. P < .05 was considered significant. The abilities of lnc‐MEG3 relative expression, miR‐21 relative expression, and lnc‐MEG3/miR‐21 axis in predicting sepsis risk were identified by ROC curve and AUC with 95% CI. Lnc‐MEG3, long non‐coding RNA maternally expressed gene 3; AUC, area under the curve; CI, confidence interval; HCs, healthy controls; miR‐21, microRNA‐21; and ROC, receiver operating characteristic
