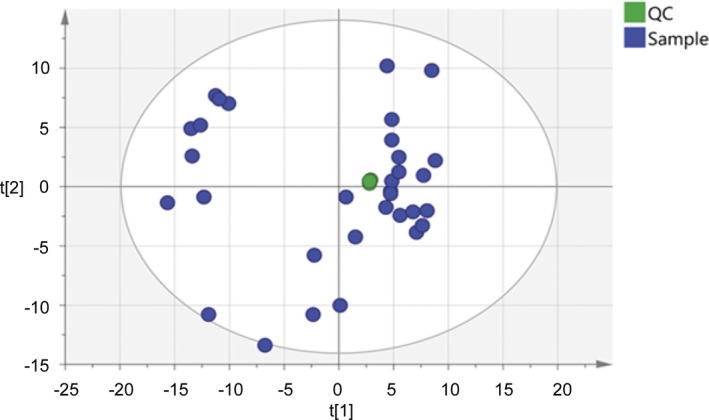
Figure 1.

The principal component analysis (PCA) score plot of the 6 quality control (QC) and amniotic fluid samples. QC samples were applied to exhibit the stability of the LC‐HRMS system. The cluster of the QC samples in the PCA score scatter plot showed a satisfactory stability and repeatability of this lipidomic analysis approach. The colors display the subjects from different groups. The green dots represent QC samples, and the blue dots represent amniotic fluid samples
