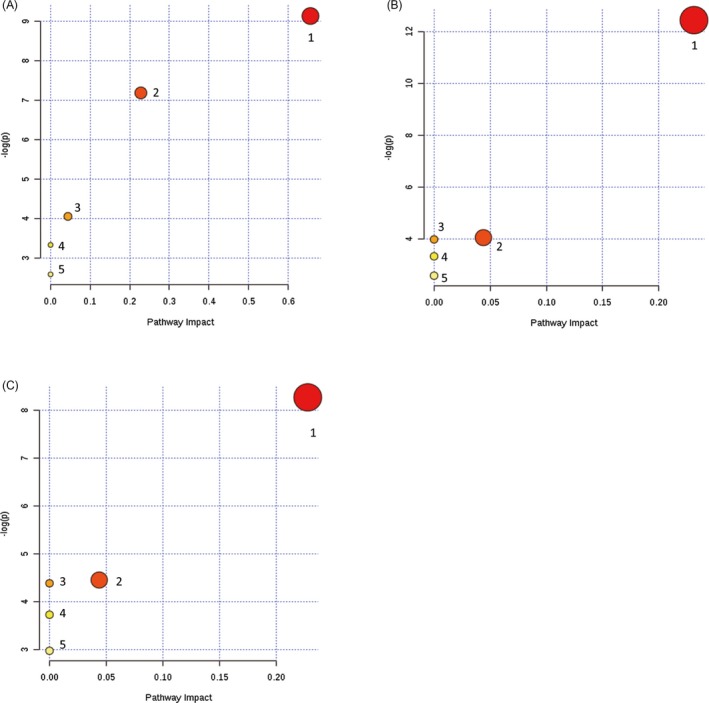
Figure 2.

The pathway analysis of lipid metabolism among amniotic fluid of different FLM development status, presenting metabolic pathways arranged according to the scores from enrichment analysis (y‐axis) and from topology analysis (x‐axis). The darkness of the circles stands for the statistical significance in the corresponding pathway, and the radius represents the centrality measures. The pathway analysis details were elaborated in Table 4. A, comparison of lipid metabolism between premature group (GW < 37) and control group (GW = 18); B, comparison of lipid metabolism between mature group (GW < 37) and control group (GW = 18); C, comparison of lipid metabolism between mature group (GW> 38) and control group (GW = 18)
