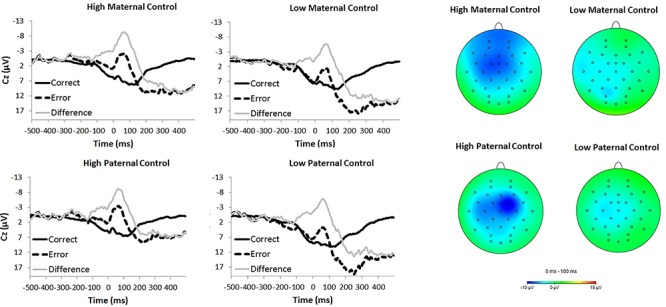
Fig. 1.

On the left, waveforms are presented for error trials (dotted black line), correct trials (solid black line) and the difference (error minus correct; gray line), for individuals who reported their parent (maternal on top; paternal on bottom) was high or low on the control scale of the CRPBI (based on a median split). On the right, topographical headmaps are presented for activity from 0 to 100 ms after responses (error minus correct). Headmaps are presented based on a median split on the control scale of the CRPBI for maternal (top) and paternal (bottom) parenting style.
