
Figure 1.
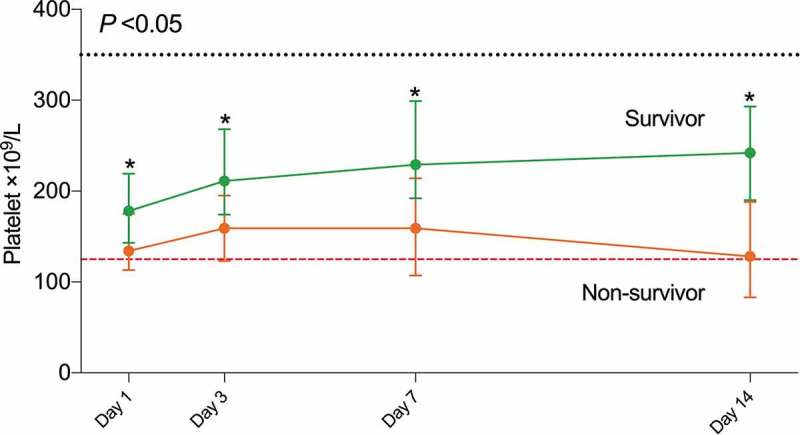
Timeline charts illustrate the platelet levels in 383 patients with COVID-19 (49 non-survivors and 334 survivors) on day 1, day 3, day 7, and day 14 after admission
Data are represented as median and 95% confidence interval. The dash lines in black show the upper normal limit of platelets, and the dash line in red shows the lower normal limit of platelets. Generalized linear-mixed models examined the differences in the platelets between non-survivor and survivor groups over time.* P < .05 for non-survivor vs. survivor.