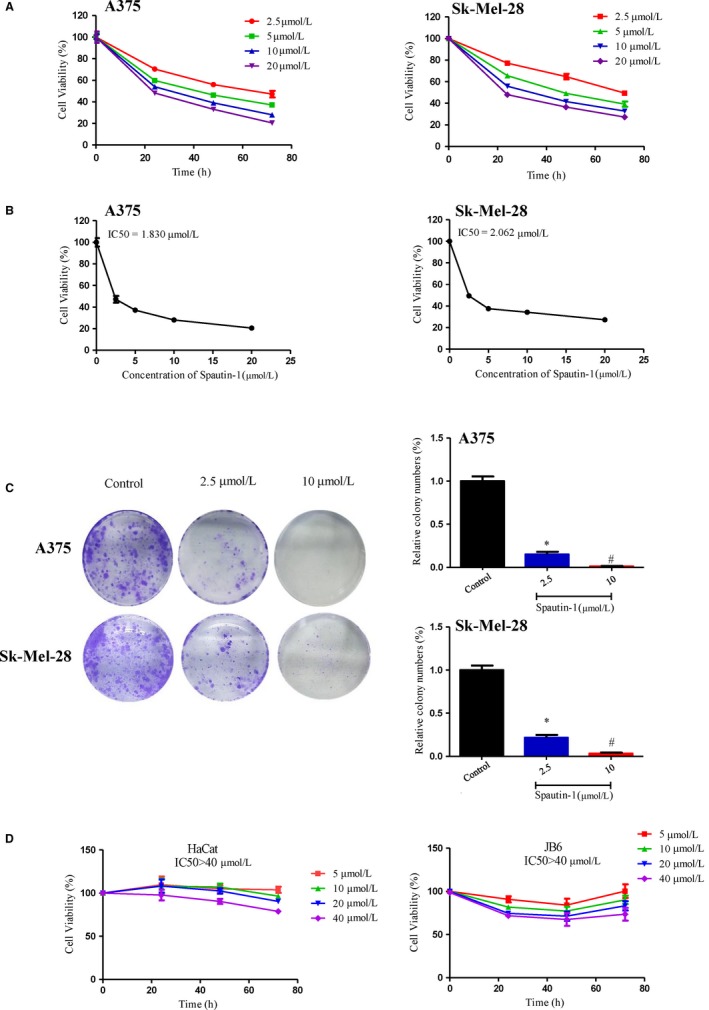
Figure 2.

Spautin‐1 significantly attenuated proliferation of melanoma cells in a time‐ and dose‐dependent manner. A, Viability analysis after the treatment of A375 and Sk‐Mel‐28 cells with different concentration of spautin‐1 (up to 20 µmol/L) for 0, 24, 48 and 72 h. (Mean values ± SEM, n = 6). B, The IC50 values of spautin‐1 in A375 and Sk‐Mel‐28 were automatically calculated by GraphPad Prism software. C, spautin‐1 inhibited A375 and Sk‐Mel‐28 cell colony formation. The number of colonies normalized to the corresponding untreated cells formed colonies. (Mean values ± SEM, n = 3) Significant differences were evaluated using a one‐way ANOVA. *P < .05 vs control group, # P < .05 vs 2.5 µmol/L. D, Non‐tumorigenic cell lines (HaCaT and JB6) were treated with various concentration of spautin‐1 for 72 h as indicated, and cell viability in the presence of HaCat and JB6 was measured by MTS as described in the Section 2 and analysed by GraphPad Prism software (mean values ± SEM, n = 6)
