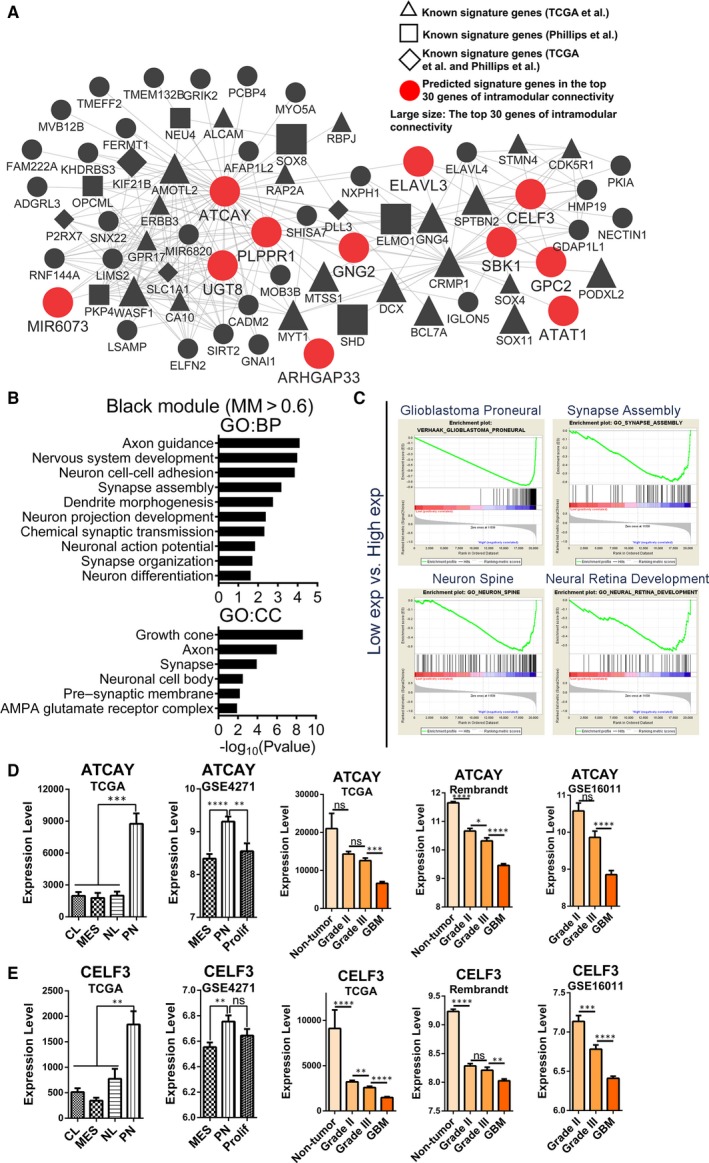
Figure 2.

Functional annotation for black module and identification of candidate PN signature genes. (A) Network depiction of black module. Nodes correspond to genes, and lines correspond to connections, with the top 250 connections in black module shown. The red, large‐sized nodes are candidate PN signature genes. The nodes labelled with the letter ‘R’ or ‘C’ were radioresistant or chemoresistant genes. (B) Results of GO enrichment analysis for genes with MM > 0.6 in black module are shown. The GO terms are divided into two groups: BP and CC. (C) GSEA shows that several gene sets enriched in samples with high expression levels of ATCAY. (D) mRNA expression levels of ATCAY among different molecular subtypes and glioma grades in several data sets. (E) mRNA expression levels of CELF3 among different molecular subtypes and glioma grades in several data sets. Means ± SEM; one‐way ANOVA with Tukey's post hoc test; ns, P > .05, *, P < .05; **, P < .01, ***, P < .001, ****, P < .0001. GO, gene ontology; BP, biological process; CC, cellular component
