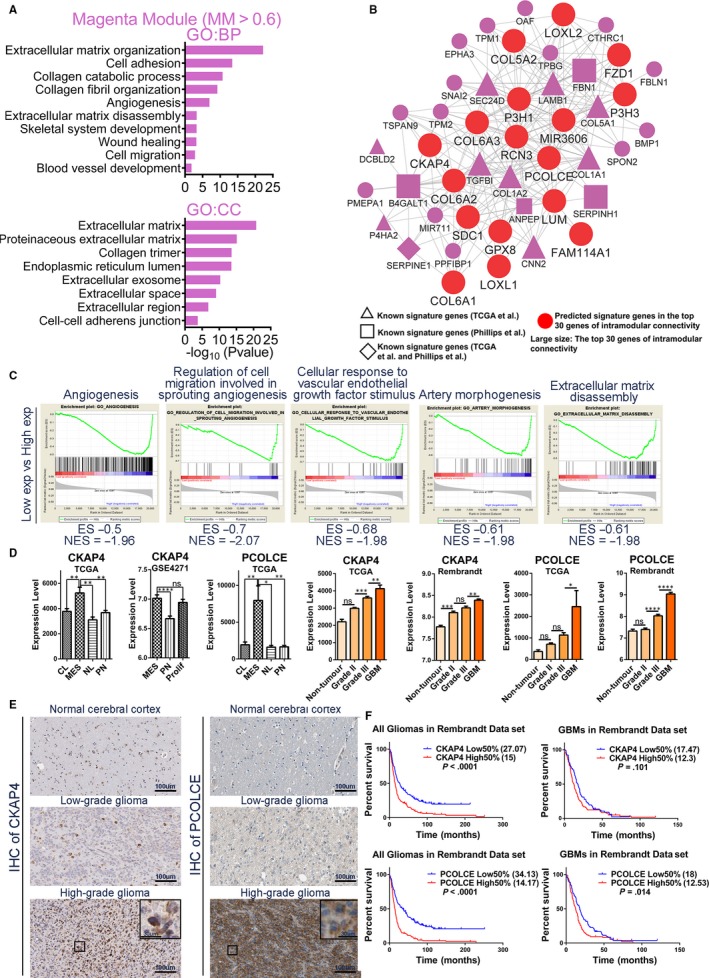
Figure 6.

Functional annotation and network analyses for magenta module. (A) GO enrichment analysis results of magenta module are shown. The GO terms are divided into two groups: BP and CC. (B) Network depiction of magenta module. Nodes correspond to genes, and lines correspond to connections, with the top 250 connections in magenta module shown. (C) GSEA shows that several gene sets enriched in GBMs with high expression levels of RCN3. (D) mRNA expression levels of CKAP4 and PCOLCE among molecular subtypes and glioma grades in different data sets. (E) IHC staining shows the protein expression levels and cellular localizations of CKAP4 and PCOLCE in normal brain tissues, LGGs and HGGs. (F) According to the expression levels of CKAP4 and PCOLCE, survival analyses between high 50% expression group and low 50% expression group of all gliomas or GBMs in Rembrandt data set. Means ± SEM; one‐way ANOVA with Tukey's post hoc test; ns, P > .05, *, P < .05; **, P < .01, ***, P < .001, ****, P < .0001
