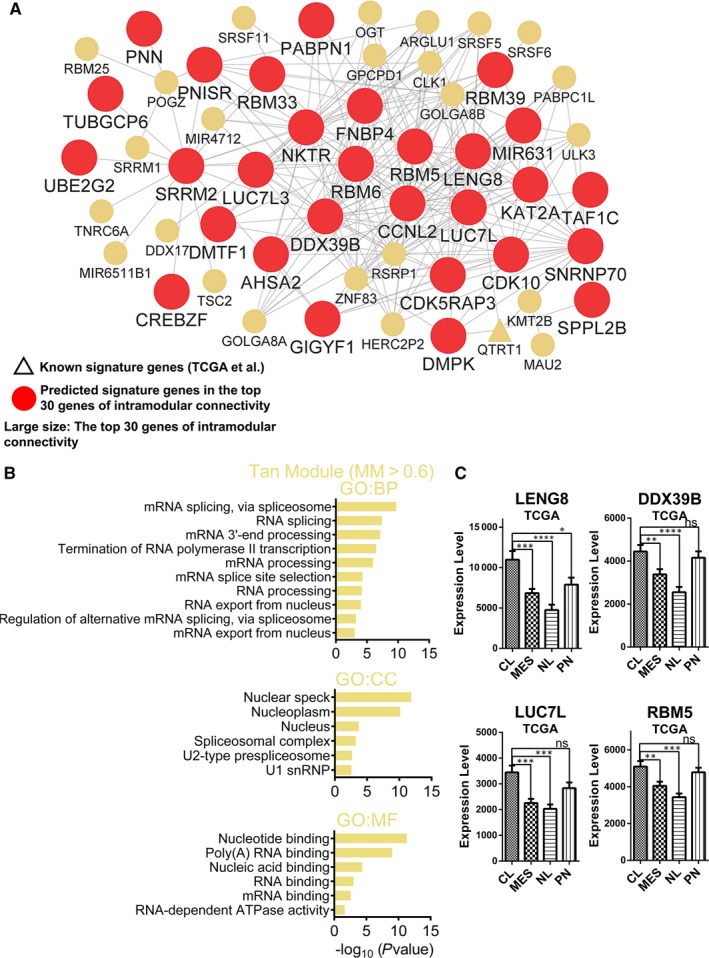
Figure 7.

Functional annotation and network analyses for tan module. (A) Network depiction of tan module. Nodes correspond to genes, and lines correspond to connections, with the top 250 connections in the tan module shown. (B) GO enrichment analysis results of tan module are shown. The GO terms are divided into three groups: BP, CC and MF. (C) mRNA expression levels of four central genes (LENG8, DDX39B, LUC7L and RBM5) among molecular subtypes in TCGA data set. Means ± SEM; one‐way ANOVA with Tukey's post hoc test; ns, P > .05, *, P < .05; **, P < .01, ***, P < .001, ****, P < .0001
