
Figure 4.
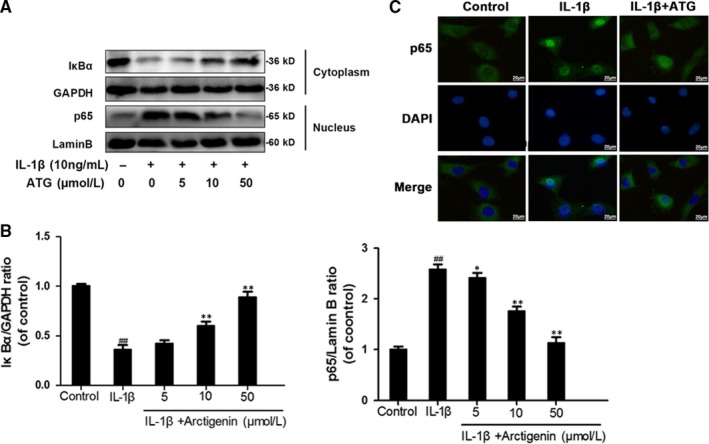
Arctigenin (ATG) attenuated IL‐1 β–activated NF‐κB signalling pathway. (A,B), The protein level of IκBα in cytoplasm and p65 in nucleus was detected by Western blotting. C, The representative fluorescence image of p65 with DAPI (nuclei); scale bar: 10 μm. Data represented are the means ± SD #P < .05, ##P < .01, vs control group; *P < .05,**P < .01, vs IL‐1β–alone treatment group, n = 5