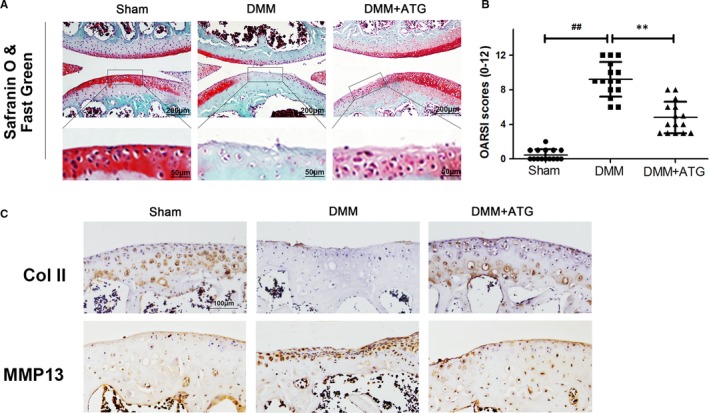
Figure 6.

Arctigenin (ATG) inhibits OA development in mice. A, Typical Safranin O staining of the cartilage and subchondral cortical bone (scale bar: 200 μm or 50 μm). B, Diagrams show the standard cartilage OARSI scores. C, Immunohistochemistry staining of collagen II and MMP13 (scale bar: 100 μm). Data represented are the means ± SD #P < .05, ##P < .01, vs control group; *P < .05,**P < .01, vs IL‐1β–alone treatment group, n = 5
