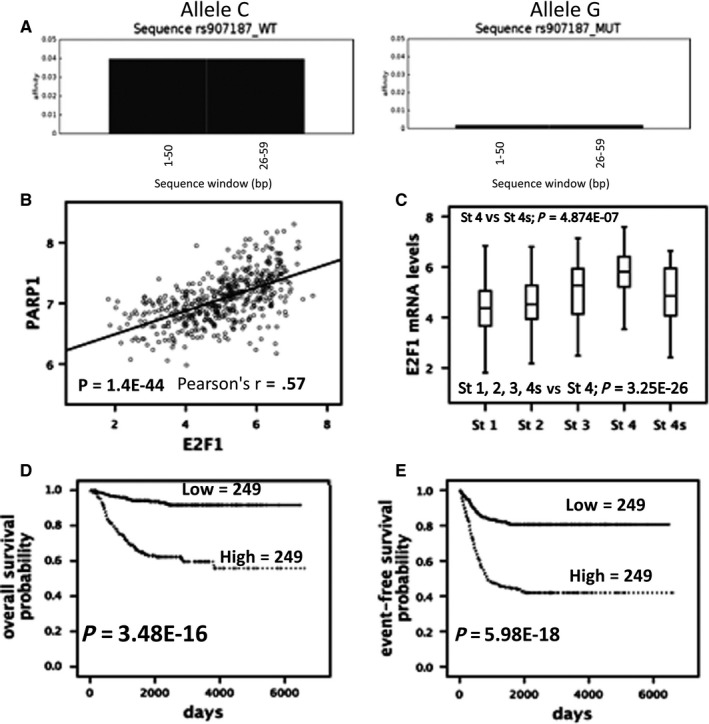
Figure 4.

Correlation between PARP1 and E2F1. (A) Prediction of nucleotide binding specificity for E2F1 transcription factor according to the rs907187 alleles (C/G). (B) Graphical representation of gene expression levels correlation between E2F1 and PARP1. (C) Box plot showing the E2F1 mRNA levels according to INSS stages using published array data from 498 patients. (D‐E) Kaplan‐Meier analysis using published array data from 498 patients
