
Figure 10.
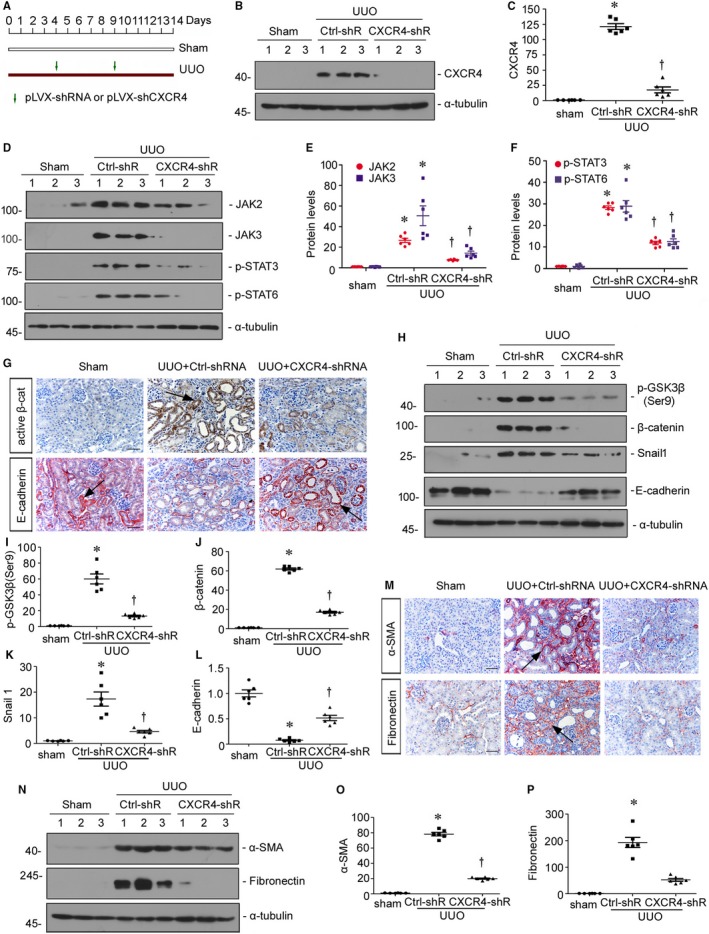
Knockdown of CXCR4 blocks renal fibrosis through inhibition of JAK/STAT/GSK3β/β‐catenin pathway. A, Experimental design. Green arrows indicate the injections of empty vector (pLVX‐shRNA) or an shRNA vector encoding the interference sequence of CXCR4 (pLVX‐shCXCR4). B and C, Representative (B) Western blots and graphical representation of (C) CXCR4 protein expression in three groups. Numbers 1‐3 indicate each individual animal in a given group. *P < .05 versus sham control mice (n = 6); †P < .05 versus UUO mice (n = 6). D‐F, Representative (D) Western blots and graphical representations of (E) JAK2 and JAK3, (F) p‐STAT3 and p‐STAT6 in three groups. Numbers 1‐3 indicate each individual animal in a given group. *P < .05 versus sham control mice (n = 6); †P < .05 versus UUO mice (n = 6). G, Representative micrographs show renal expression of active β‐catenin and E‐cadherin in three groups. Paraffin kidney sections were immunostained with an antibody against active β‐catenin or E‐cadherin. Black arrows indicate positive staining. Scale bar, 50 μm. active β‐cat, active β‐catenin. H‐L, Representative (H) Western blots and graphical representations of (I) p‐GSK 3β (Ser9), (J) β‐catenin, (K) Snail 1 and (L) E‐cadherin in three groups. Numbers 1‐3 indicate each individual animal in a given group. *P < .05 versus sham control mice (n = 6); †P < .05 versus UUO mice (n = 6). M, Representative micrographs show renal expression of α‐SMA and fibronectin in three groups. Paraffin kidney sections were immunostained with an antibody against α‐SMA or fibronectin. Black arrows indicate positive staining. Scale bar, 50 μm. N‐P, Representative (N) Western blots and graphical representations of (O) α‐SMA and (P) fibronectin in three groups. *P < .05 versus sham control mice (n = 6); †P < .05 versus UUO mice (n = 6)