
Figure 6.
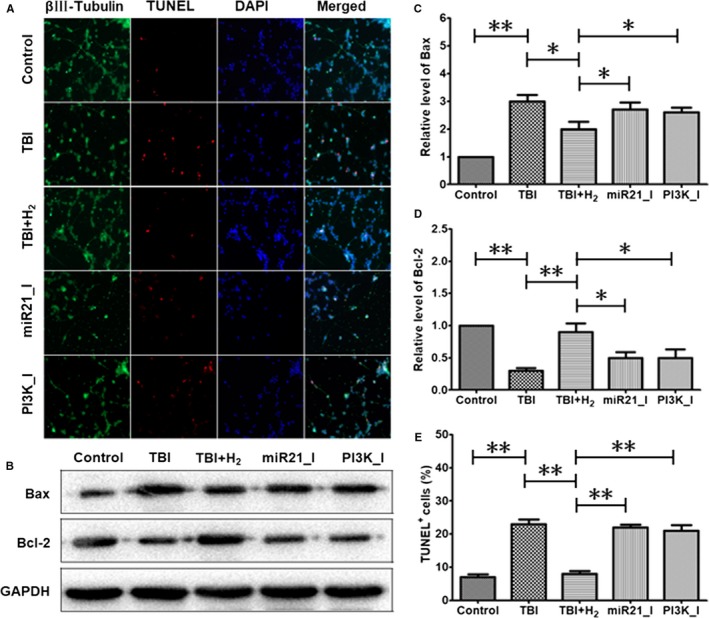
Expression levels of apoptosis‐related proteins and TUNEL staining in PC12 cells. Expression levels of Bax and Bcl‐2 proteins were measured using Western blot analysis in control cells or injured cells 48 h after scratching. Double immunofluorescence staining for βIII‐tubulin and TUNEL staining were adopted in control cells or injured cells at the same time point. The results were expressed as mean ± standard deviation. Differences in these markers among the five groups were compared using one‐way ANOVA with LSD t test. ‘*’ indicates P < .05, and ‘**’ indicates P < .01