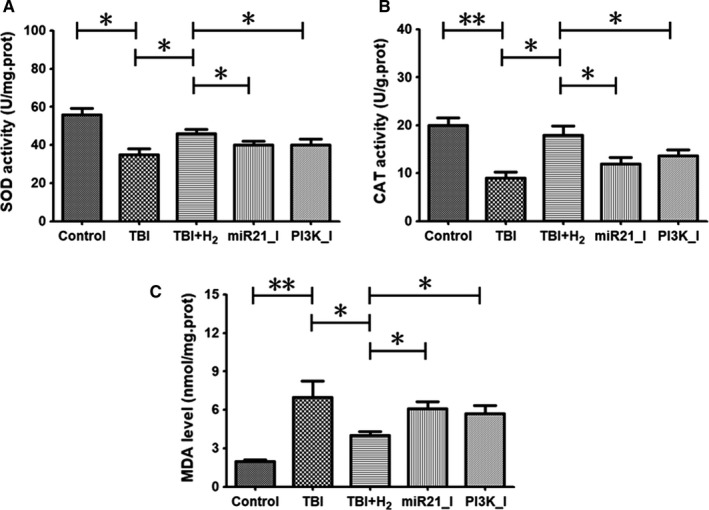
Figure 7.

Oxidative stress levels in PC12 cells. Levels of superoxide dismutase (SOD), catalase (CAT) and malondialdehyde (MDA) in control cells or injured cells 48 h after scratching were measured using their commercial test kits. The results were expressed as mean ± standard deviation. Differences in these markers among the five groups were compared using one‐way ANOVA with LSD t test. ‘*’ indicates P < .05, and ‘**’ indicates P < .01
