Figure 1.

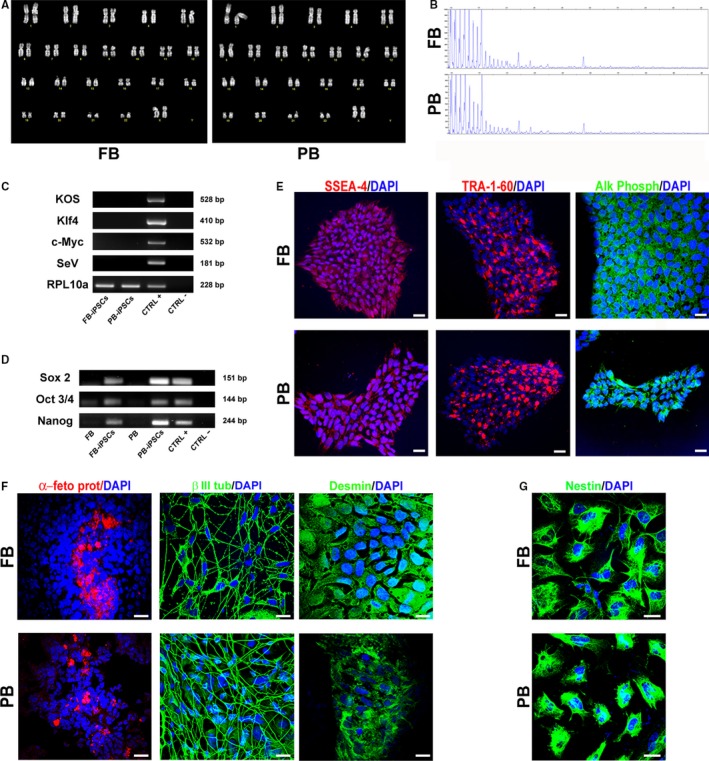
Characterization of induced pluripotent stem cells (iPSCs). A, Q‐banding karyotype of FB and PB‐derived iPSCs. B, Repeat primed PCR of iPSCs from FB and PB to confirm the G4C2‐repeat expansion. C, RT‐PCR analysis for the transgene KOS, Klf4, c‐Myc and SeV performed on FB‐iPSCs and PB‐iPSCs after the fifth passage. Reprogrammed FB were used as positive control. RPL10a was used as loading control. D, Expression of iPSC specific markers Sox 2, Oct 3/4 and Nanog assessed by RT‐PCR on starting tissues (FB and PB), iPSCs and positive control (other iPSC line). E, Representative images of iPSC colonies derived from FB and PB stained for the stemness markers SSEA‐4, TRA‐1‐60 and alkaline phosphatase (Alk Phosph). F, Differentiated EBs spontaneously generated cells of the three germ layers: endoderm (α‐feto protein positive), ectoderm (β III tubulin positive) and mesoderm (desmin positive). G, Representative images of iPSC lines differentiated towards neural fate. iPSCs differentiated for 7 days in induction medium and expanded for five passages in expansion medium became nestin positive. Nuclei were counterstained with DAPI. Scale bars, 100 μm. Images are representative of 1‐2 independent experiments
