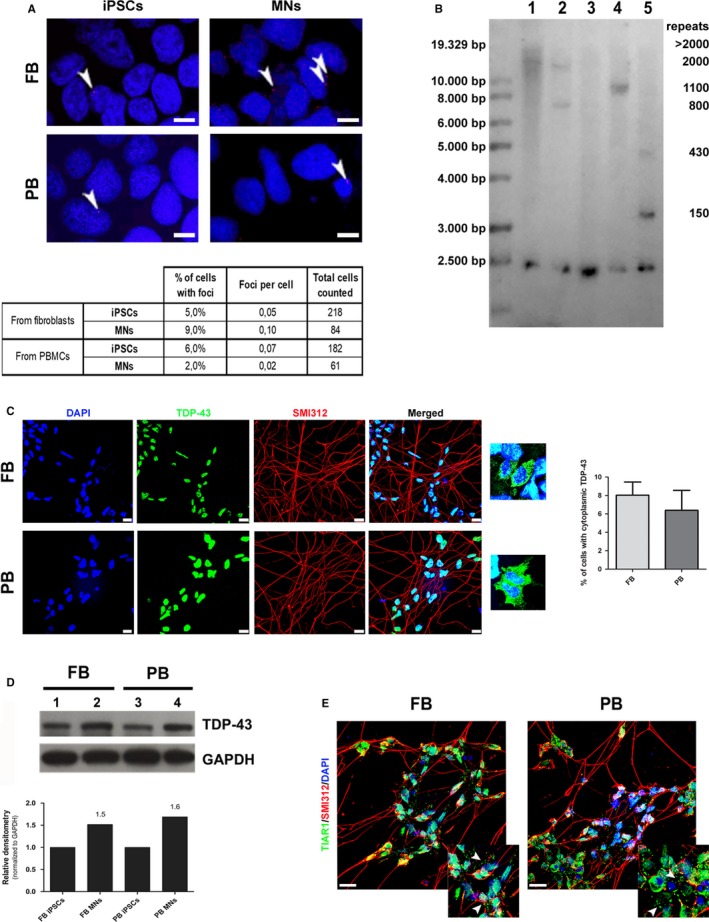
Figure 3.

Comparison of specific pathological hallmarks in FB‐ and PB‐derived cells. A, The percentage of cells with foci and the number of foci per cell were evaluated in both iPSCs and iPSC‐derived MNs by FISH technique. Foci are indicated by head arrows. Scale bar, 5 µm. B, Southern blot analysis on DNA obtained from PB and FB (lanes 1 and 4) and PB‐ and FB‐derived iPSCs (lanes 2 and 5). Sample from a healthy donor (negative control) is shown in lane 3. C, Motor neurons derived from FB‐ and PB‐iPSCs were analysed to observe localization and aggregation of TDP‐43 protein (green) by immunofluorescence. Cells were co‐stained with the pan‐axonal neurofilament marker SMI312 (red). Scale bar, 20 µm. Magnification of cells displaying a cytoplasmic mislocalization. D, Western blot analysis of the total amount of TDP‐43 protein in iPSCs (lanes 1 and 3) and iPSC‐derived MNs (lanes 2 and 4). Densitometry analysis in lower panel: for both FB and PB‐derived MNs, the expression was calculated using as reference the TDP‐43 protein level of their corresponding iPSCs. E, Representative images of differentiated MNs following acute treatment with sodium arsenite (0.5 mmol/L, 1 h). After treatment, MNs were immunostained for the stress granule marker, TIAR1 (green) and the pan‐axonal neurofilament marker SMI312 (red). Scale bar, 20 µm. Stress granules are indicated by head arrows in the magnification panels. MNs images are representative of two independent experiments
