
Figure 11.
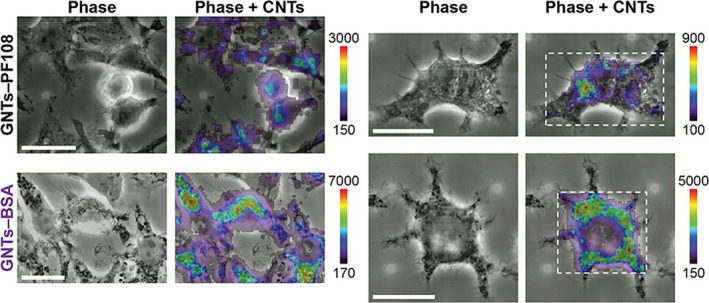
Cytoplasmatic distribution of gadofullerenes. Raman mapping of the subcellular distribution of gadonanotubes within the J774A.1 macrophage cell line. Gadonanotubes dispersed with the surfactant PF108 (GNTs—PF108) and those dispersed with BSA (GNTs‐BSA). Scale bars represent 20 μm, and the colour bar indicates the local CNT concentration. Reprinted with permission from ref,70 copyright 2015 American Chemical Society