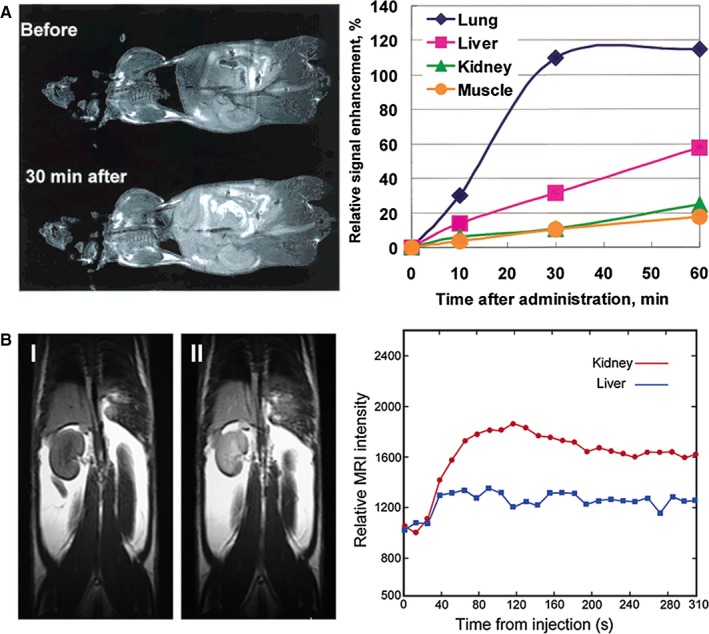
Figure 12.

Biodistribution studies of gadofullerenes. (A) T1‐weighted MRI of CDF1 mice before and 30 min after intravenous administration of Gd@C82(OH)40 via the tail vein (left) and its time‐dependent signal intensity changes in various organs (right). Reprinted with permission from,12 copyright 2001 American Chemical Society. (B) T1‐weighted MRI of CDF1 mice before and 16 min after administration of Gd@C60[C(COOH)2]10. Increased signal intensity is displayed in the kidney (left); representative in vivo MRI intensity‐derived biodistribution data showing the Gd@C60[C(COOH)2]10 signal enhancement within the first 5 min of administration, revealing rapid renal uptake with a minimum of liver uptake (red circles, kidney; blue squares, liver) (right). Reprinted with permission from,45 copyright 2003 American Chemical Society
