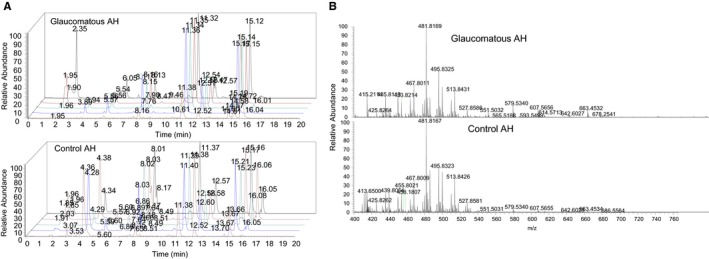
Figure 1.

Representative chromatogram and mass spectra of AH lipids. A, Chromatogram from Acela HPLC that was coupled with high‐resolution Q‐Exactive Orbitrap mass spectrometer. Five samples each for glaucoma and control or normal (as indicated) are depicted by different colours. B, Representative mass spectrogram. Product ion spectra of negative ion phospholipids from AH samples
