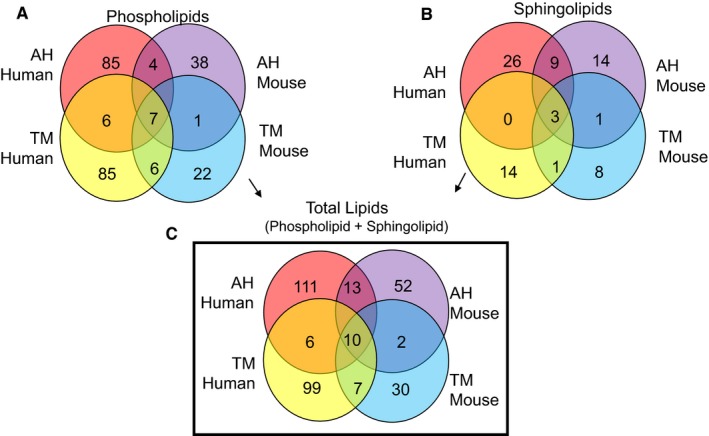
Figure 3.

Comparison of AH and TM enriched lipid species between healthy human and normotensive DBA2J groups. Enriched lipid species were those which had a >10 concentration in healthy/normotensive groups when compared to POAG/hypertensive groups in human and mice respectively (see Tables 1 and 2). Lipid species that were common in all four groups and that underwent a greater fold change in the TM compared to the fold change in AH were selected. That is, fold change TM divided by fold change AH > 1. The fold change TM here refers to amount of lipid normalized to protein content in healthy TM divided by POAG TM. The fold change AH similarly refers to amount of protein normalized lipid species in healthy AH divided by POAG AH (see Tables 1 and 2). A, Comparison of phospholipids, B, comparison of sphingolipids and C, comparison of phospho‐ and sphingolipids combined, in human and mouse AH and TM
