Figure 5.

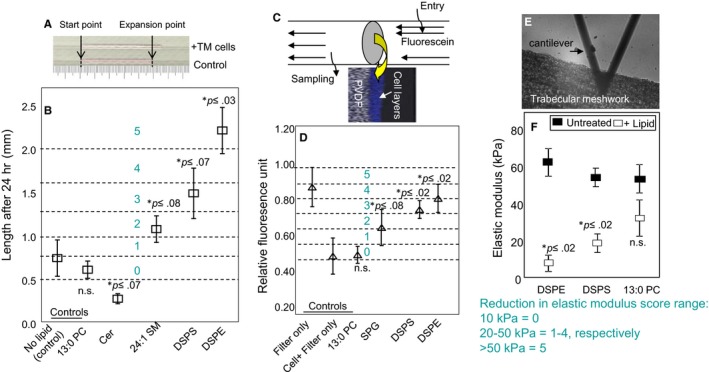
Cell‐ and tissue‐based assays to evaluate lipid properties. All results are from three independent experiments. Mean and standard deviation have been presented where appropriate. A, Collagen gel embedded expansion and/or contraction assay. Primary TM cells (10 000) untreated control or lipid‐treated (10 PM of the indicated lipid) were placed in a capillary tube with rat collagen. The change in collagen column length was measured after 24 h. B, Mean values were categorized into five scoring zones (0‐5 in blue), as indicated. Each experiment is mean of 10 independent measurements, and Mean ± standard deviation has been reported. The test samples were compared to untreated controls, and P value for two‐paired t test has been reported. Untreated is primary TM cells without lipid treatment. C, Assay for fluorescein transport across multilayered TM cells using an Ussing‐type chamber. Layered TM cells were casted on a PVDF filter. Filter‐only, untreated cells + filter and cells treated with lipids + filter were tested. The transport of fluorescein at 15 s from the opposite end after the introduction of sample at one was estimated. D, Mean values were categorized into five scoring zones (0‐5), as indicated. Mean ± standard deviation for 10 independent readings each with P value for paired t test compared to controls have been presented. E, Modulation of elastic modulus of TM tissue by lipids. The position of cantilever in the TM tissue is shown. F, The elastic modulus for untreated (control) and lipid‐treated TM tissue was determined using Atomic force microscopy. Mean values of reduction in elastic modulus from a initial point were categorized into five scoring zones (0‐5), as indicated. 13:0 PC is a control lipid that is expected not to show any IOP lowering effect. Mean ± standard deviation for 20 independent measurements each with P value for paired t test compared to controls has been presented. (n.s. = not significant)
