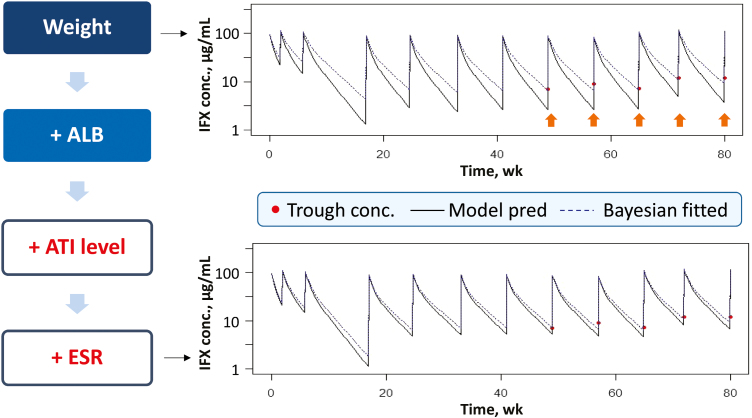
FIGURE 1.
Stepwise covariate analysis for a representative patient case. The example shows how well the model-predicted PK profile overlaid with the actual observations. The addition of serum albumin concentration, ATI category, and ESR improved the prediction of the observed IFX trough concentrations (B) in comparison with the base model, which included body weight as a covariate (A). The orange arrows highlight how the base model was not as accurate in predicting IFX trough concentrations, especially at >40 weeks.

