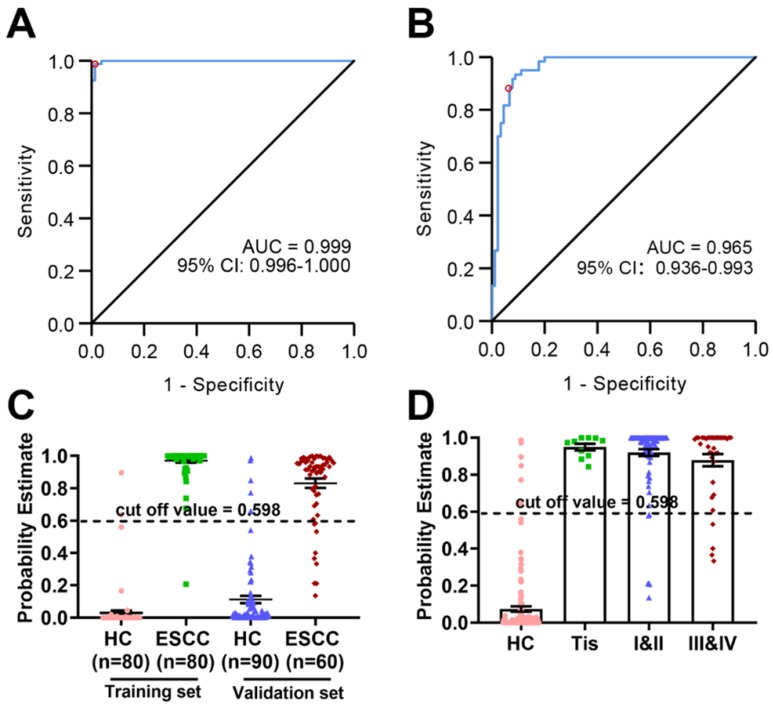
Figure 5.
Probability estimates based on eight metabolites from plasma. The diagnostic outcomes in the training set (A) and validation set (B) are shown via the receiver-operating characteristic (ROC) curves for comparison between ESCC and HC. (C) Score of the ESCC biomarker signature identified in the training set and applied on the validation set. (D) Probability estimate in different stages of ESCC patients (stage 0/Tis, I-II, III-VI) relative to HC.

