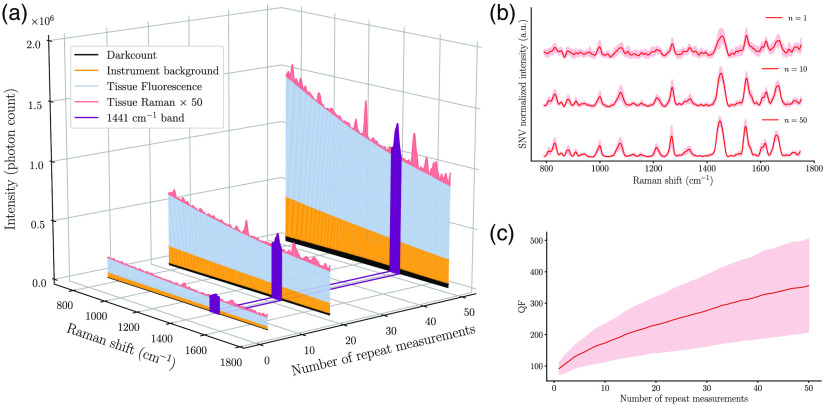
Fig. 1.
(a) Depiction of the relative proportion of different sources of signal in a human brain measurement made using a Raman spectroscopy system, including dark counts and background (e.g., fluorescence from tissue and optical components). Measurements are shown that were averaged over different number of repeated acquisitions: , 20, and 50. The band is highlighted to represent a band typically used to assess spectral quality. For visualization purposes, the Raman signal shown is amplified by a factor of 50. (b) Processed Raman spectra acquired in vivo in brain cancer tissue for different numbers of repeat measurements (1, 10, and 50). (c) QF as a function of the number of repeat measurements. In both (b) and (c), the solid line and shaded area represent the average and the standard deviation over 15 spectra acquired at different brain locations, respectively.

