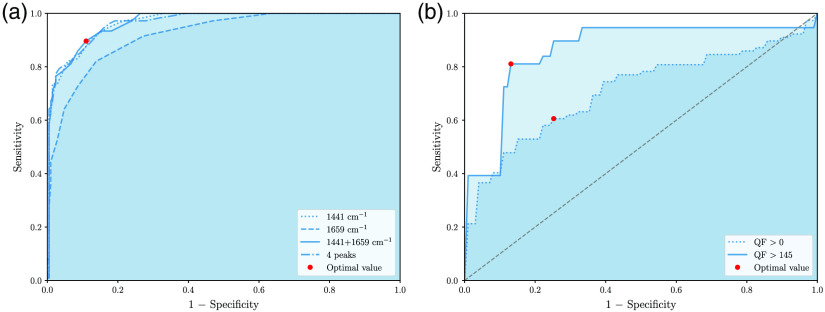
Fig. 2.
ROC curves showing (a) the correspondence between the qualitative and quantitative spectral quality metrics and (b) the classification performance for different QF thresholds. (a) Each ROC curves were computed for different combinations of Raman bands and are parameterized with the quantitative QF-metric. The qualitative threshold for high spectral quality was . The QF value optimizing both sensitivity and specificity is shown as a red dot and corresponds to . (b) ROC curves for normal versus cancer classification using all spectra from the dataset and only spectra with . The parameter on the curves optimizing sensitivity and specificity is shown as a red dot.

