FIGURE 3.

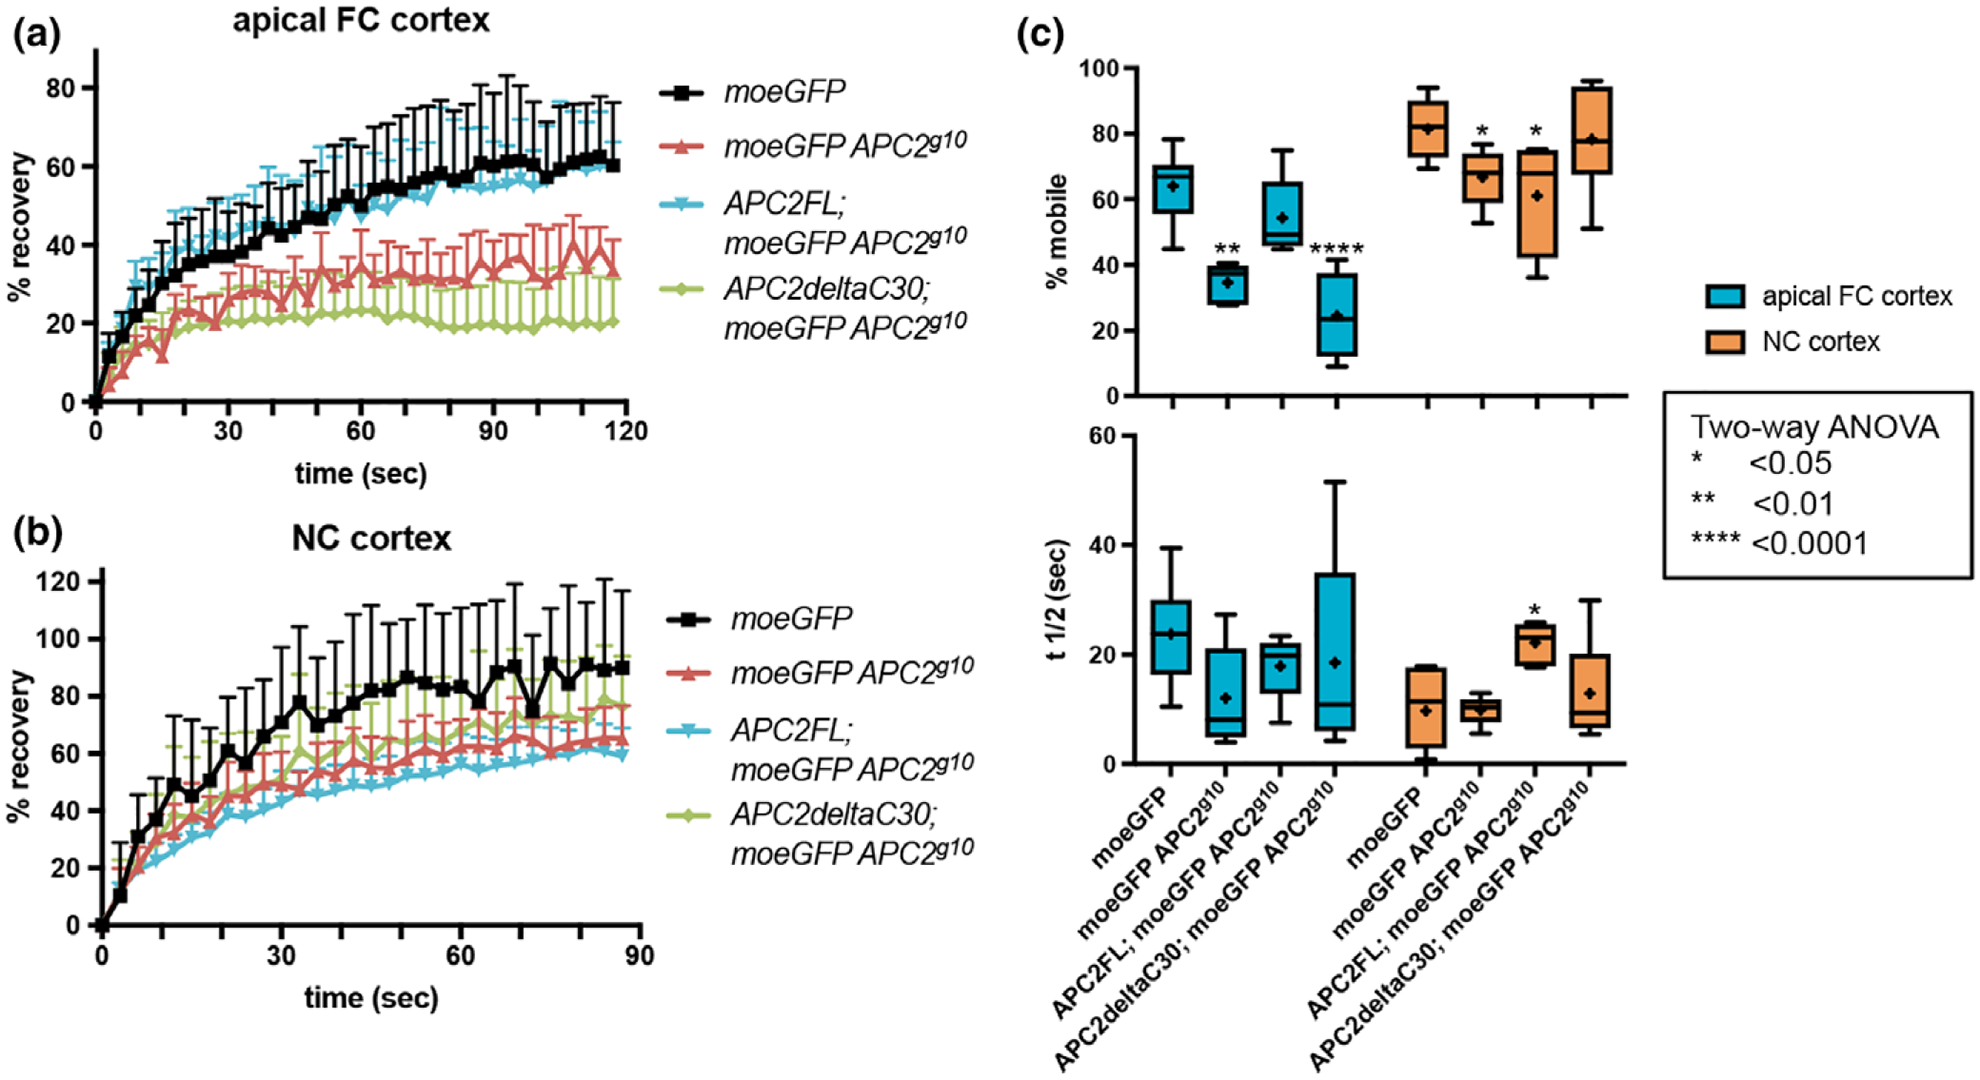
Disruption of APC2’s cortical localization alters cortical dynamics. (a, b) Normalized raw fluorescence recovery data for the indicated genotypes at the apical FC cortex (a) and the NC cortex (b). Each line represents the average of the raw data for the genotype indicated with the error bars illustrating the standard deviation. (c) the percent mobile fraction (top) and t1/2 (bottom) at the apical FC cortex (blue) and NC cortex (orange) in the genotypes indicated. Each box extends from the 25th to 75th percentiles, and the whiskers indicate the minimum and maximum values. The line within each box is the median, and the + indicates the mean. At the apical FC cortex, complete loss of APC2 (APC2g10) or deletion of the C30 domain (APC2ΔC30) significantly reduced the mobile fraction. Expression of APC2-FL rescued this defect. The t1/2 did not differ significantly between the genotypes. At the NC cortex we saw a similar decrease in mobile fraction in the APC2 null, and this was not rescued by APC2ΔC30. Expression of APC2FL resulted in a significantly reduced mobile fraction like the null at the NC cortex, and a significantly increased t1/2 unlike any other genotype
