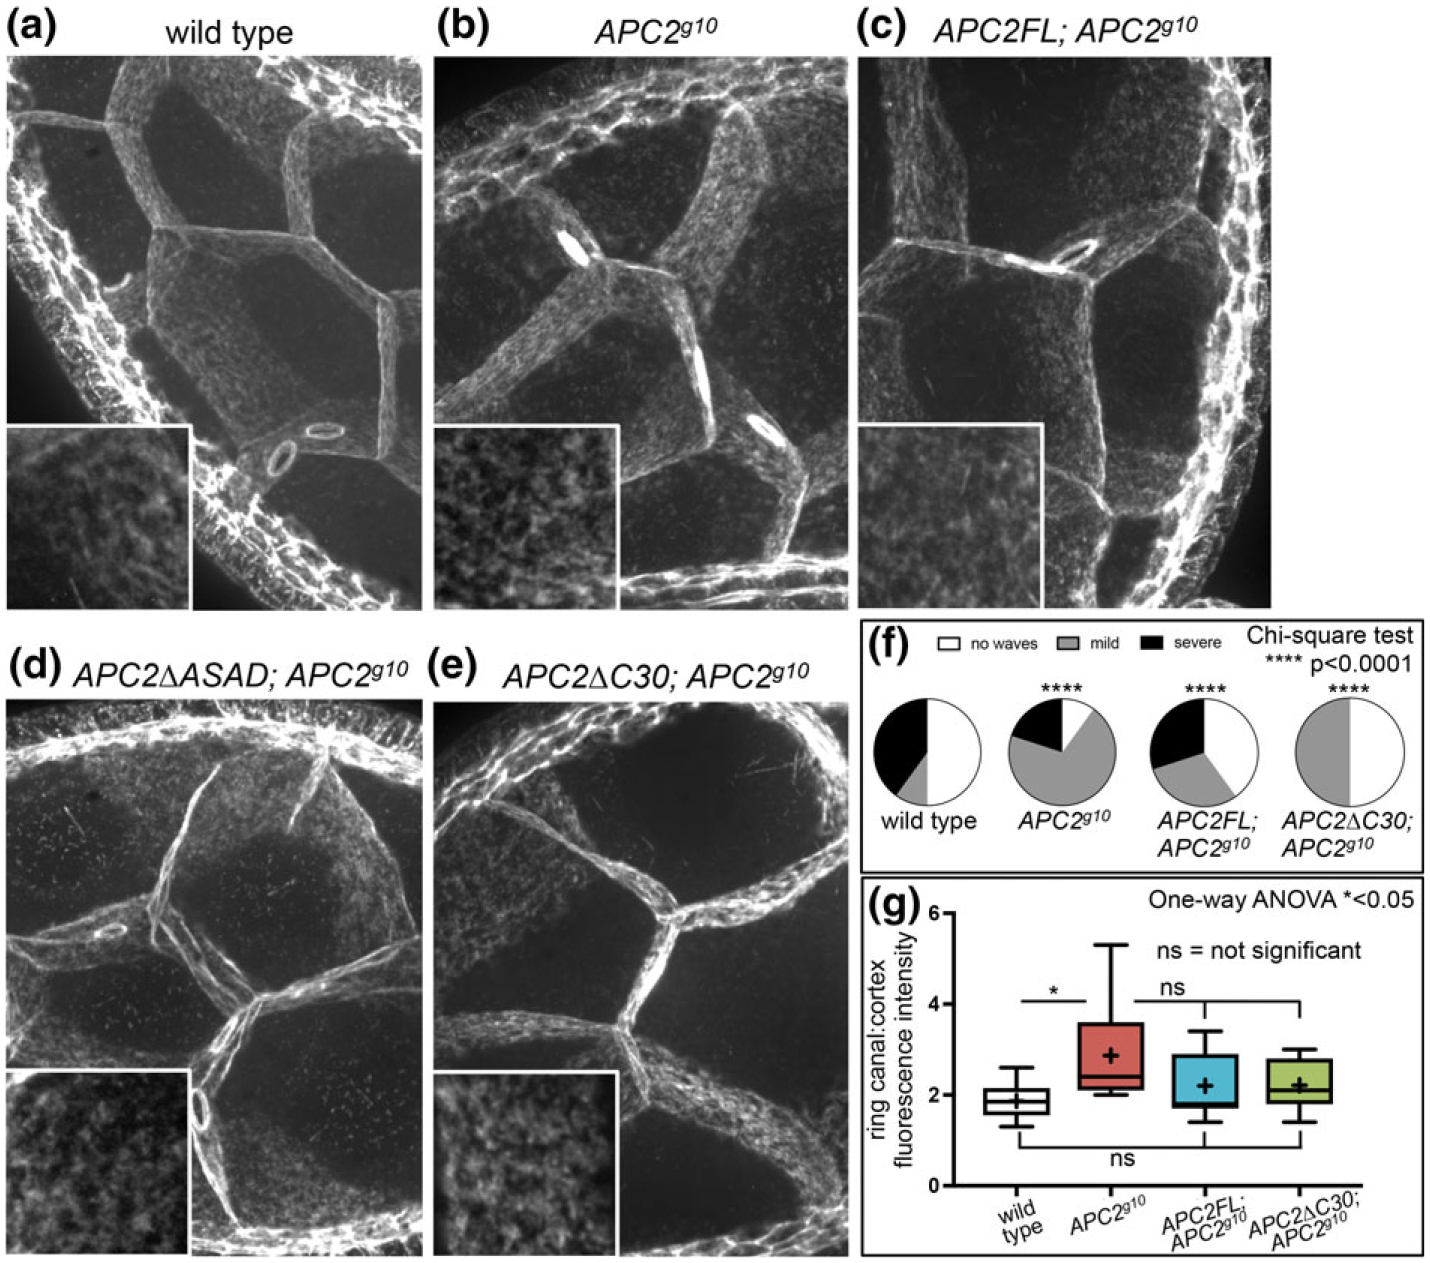
FIGURE 4.

Disruption of APC2 in the nurse cells does not significantly alter cortical actin accumulation or overall cortical structure. (a–e) projections of 30 0.2 μm z-slices of phalloidin stained stage 8 egg chambers reveal the basic organization of the NC cortex in the genotypes indicated. Insets show higher magnification views of the cortical actin network in NCs. While the cortical network typically appears uniform and planar (a, arrowhead), we did observe irregularities like the waves in (d, arrowhead) in wild type and mutant NCs. Scale bar, 5 μm; inset, 1 μm (f) the percent of egg chambers with cortical waves. The frequency and severity of cortical waves was highly variable with every genotype significantly different from the wild type. N = 10 for each genotype. (g) the relative fluorescence intensity of the ring canals in the APC2 null was significantly greater than in the wild type (a, b arrows). The relative intensity in APC2FL; APC2g10 and APC2ΔC30; APC2g10 was not significantly different from either the wild type or from APC2g10. Each box extends from the 25th to 75th percentiles, and the whiskers indicate the minimum and maximum values. The line within each box is the median, and the + indicates the mean. For wild type, the median and the mean are the same. N = 10 for each genotype
