FIGURE 5.

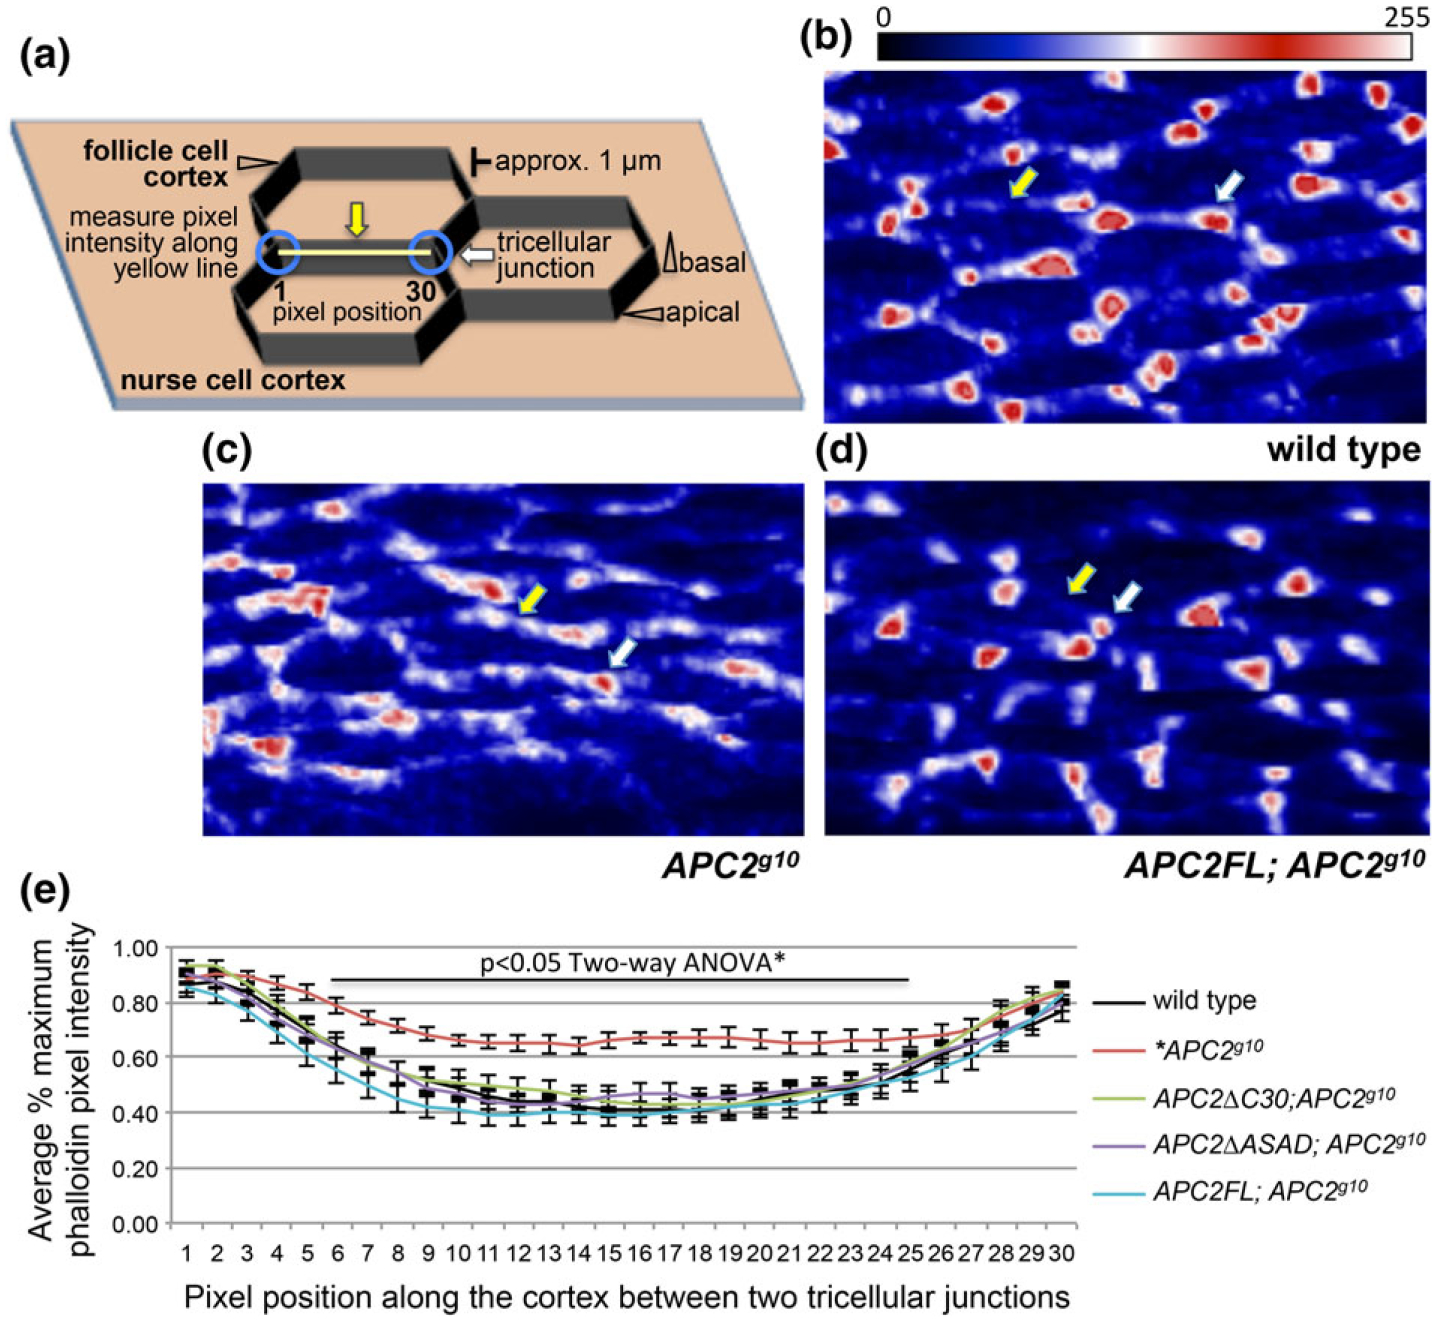
Complete loss of APC2 disrupts the heterogeneous accumulation of actin at the apical cortex in the follicle cells. (a) Schematic of the cellular arrangement, landmarks, and the quantification strategy employed for (b–e). The white arrow indicates a tricellular junction, and the yellow arrow indicates the apical cortex between two tricellular junctions (blue circles). For the analysis in e, pixel intensity was measured for 30 pixels along the cortex (yellow line) between two tricellular junctions. (b–d) rotated projections of six 0.2 μm optical sections of the apical ends of phalloidin stained FCs of the indicated genotypes. As in (a), the white arrow indicates a tricellular junction, and the yellow arrow indicates the apical cortex between two tricellular junctions. The images have been pseudo-colored using the look-up table shown (Fiji) to highlight the relative intensity differences between the tricellular junctions and the intervening cortex within an image (see methods for details). In wild type FCs (b), and in APC2 null FCs expressing APC2FL (d), actin at the apical cortex is enriched at the tricellular junctions (b,d white arrow) compared to the intervening cortex (b,d yellow arrow). In the APC2 null mutant (c), the actin distribution appears more homogenous with more actin along the intervening cortex (c, yellow arrow). (e) Quantification of pixel intensities as described in (a) for the genotypes as shown. This illustrates the distinction between apical cortical actin distribution in wild type FCs (black) and APC2g10 FCs (red). The APC2 null defect in apical cortical actin distribution was rescued by APC2FL (blue), APC2ΔC30 (green), and APC2ΔASAD (purple). N = 16–24 lines/genotype scale bar = 5 μm
