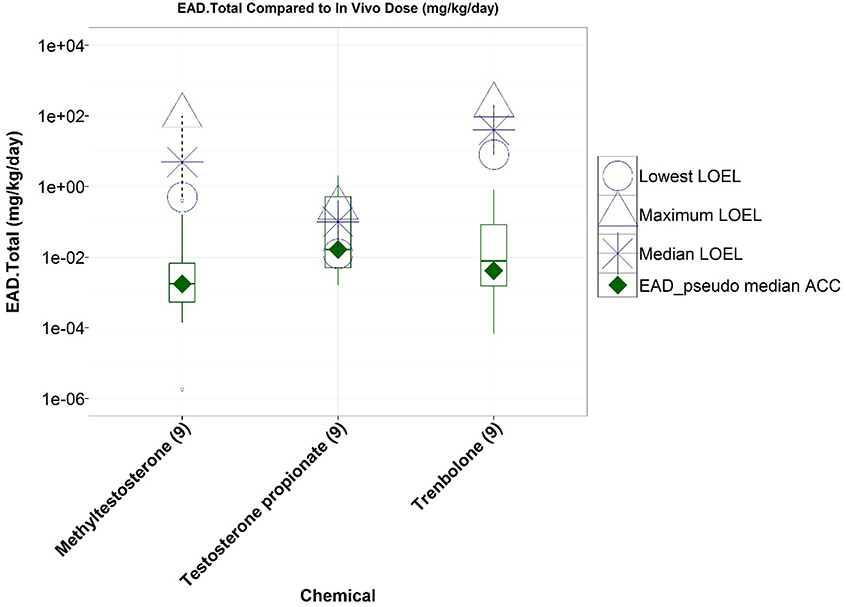
Figure 2.
Comparison of lowest observed effect levels (LOELs, open symbols) from Hershberger agonist studies to chemical-specific equivalent administered doses (EADs) derived from nine ToxCast/Tox21 in vitro AR agonist pathway assays. Boxplots represent distribution of EADs from in vitro assay activity concentrations at statistically significant cutoffs, and the EAD from the AR pathway agonist model pseudo-ACC is represented by a green diamond. All three chemicals were active in all nine agonist-mode assays (numbers in brackets).

