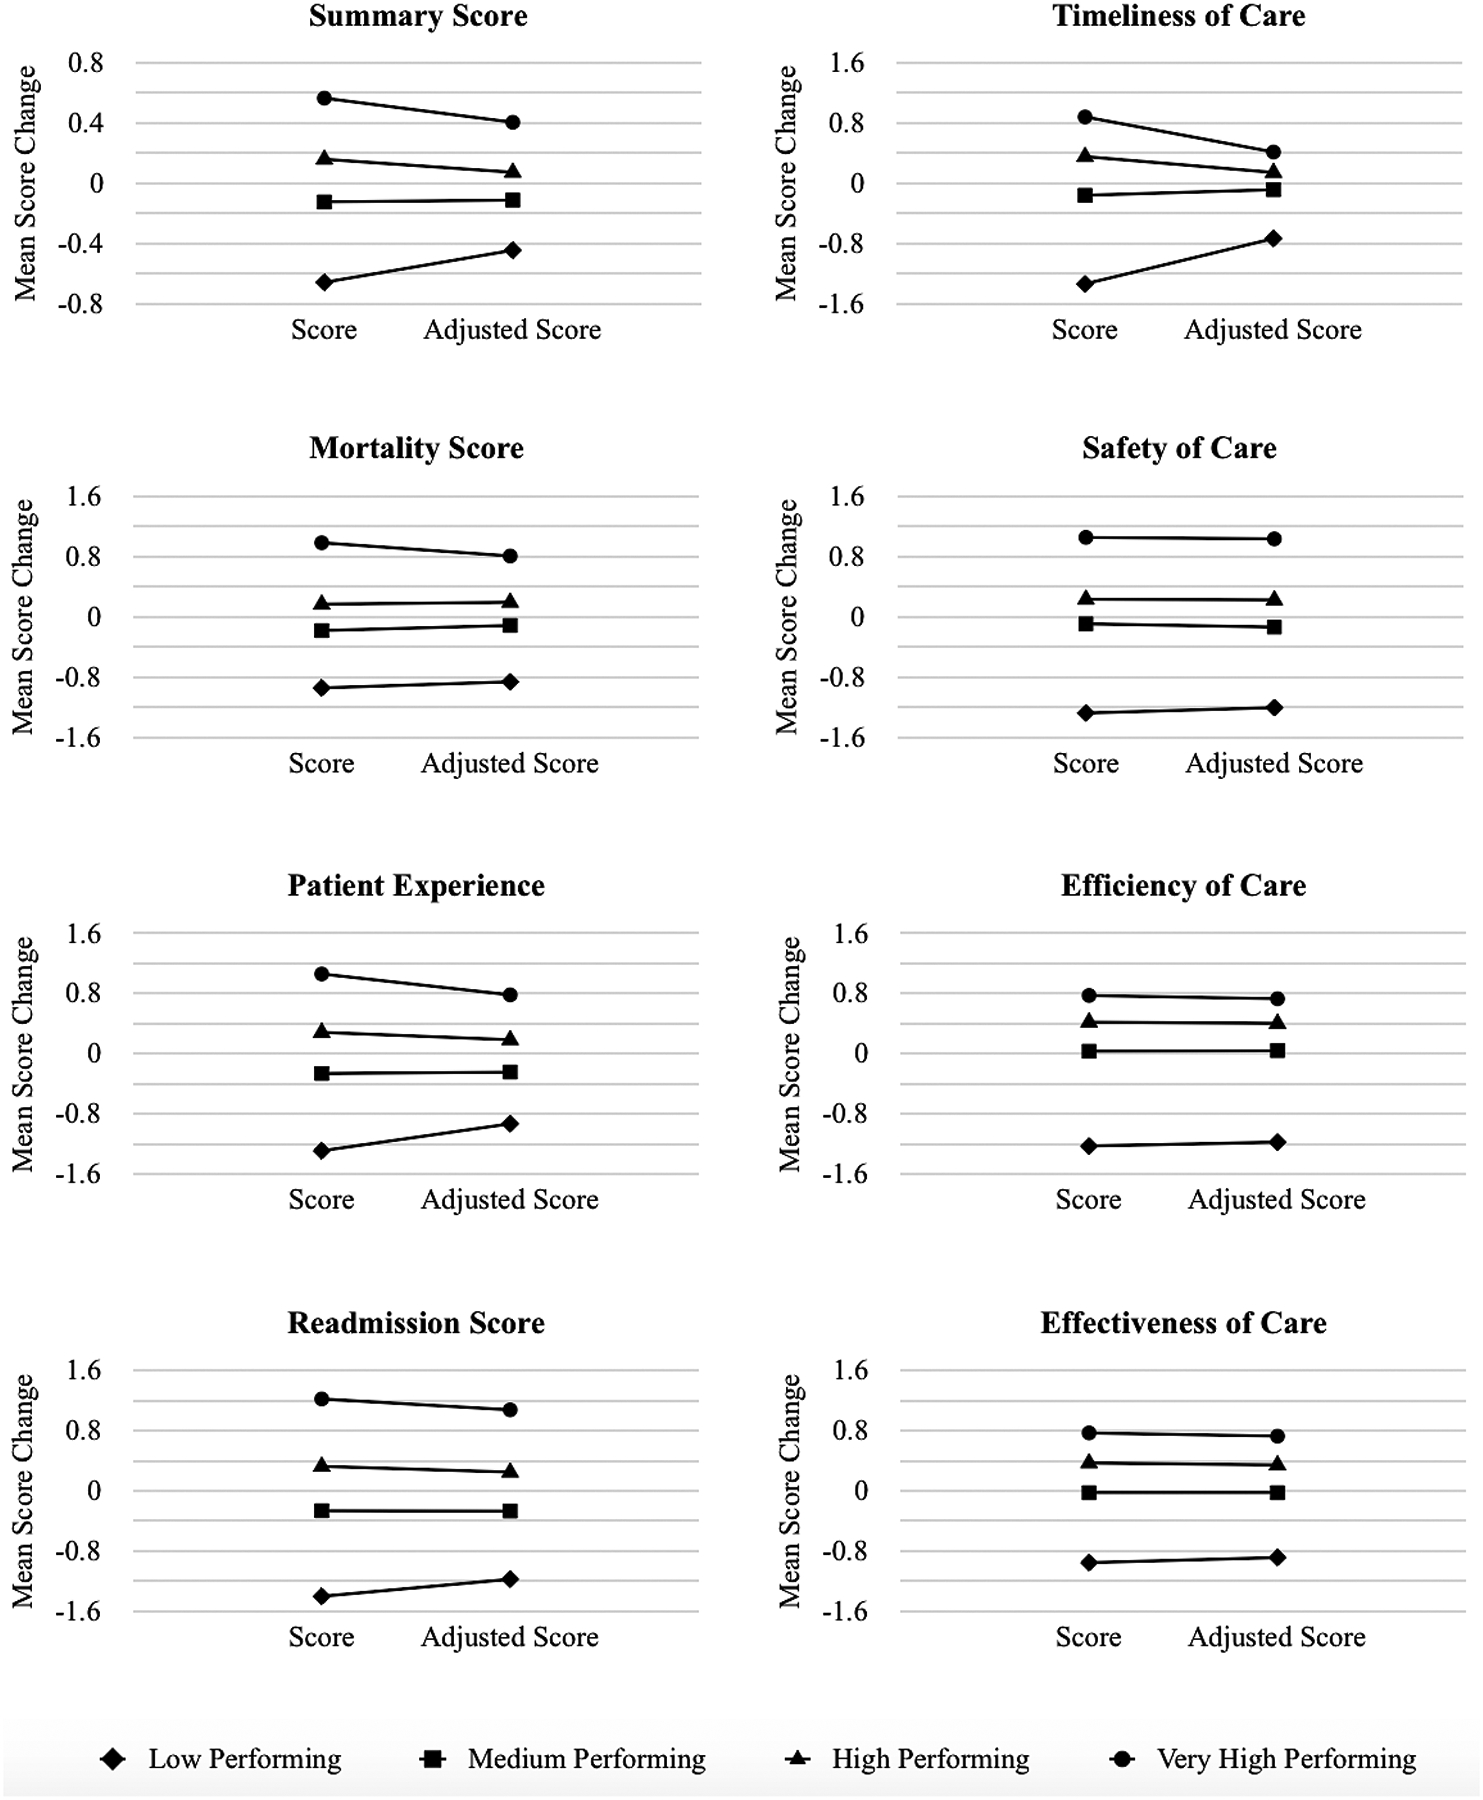
Figure 2. Change in overall and quality group scores by performance quartile before and after risk adjustment for neighborhood social risk factors.

The hospitals were grouped by quartiles using summary or individual domain scores. The mean score for each group before and after SRF risk-adjustment was calculated. SRF risk-adjustment did not change the ordering of performance quartiles on average, but the range in scores narrowed between quartiles showing that the variance caused by the SRF was removed. In effect, risk adjustment reduced differences in score between the highest and lowest performing hospitals, without substantially altering their overall ordering.
