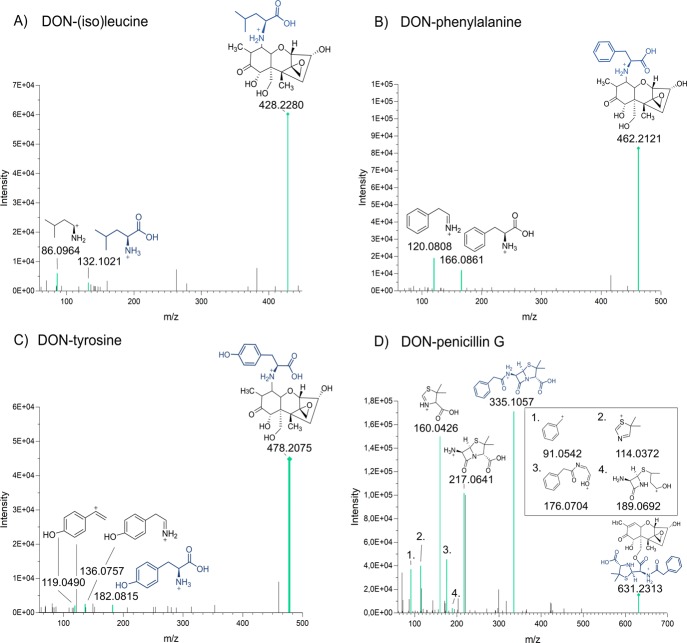
Figure 3.
MS2 spectra illustrating conjugates of DON with amino acids and an antibiotic in positive mode [M + H]+, where fragments present in the spectra of the pure compound found in mzCloud too are colored in turquoise. All spectra were acquired with a stepped normalized collision energy at 20 and 50 eV. (A) MS2 spectrum of DON-isoleucine/leucine of m/z 428.2292 at 6.82 min, (B) MS2 spectrum of DON-phenylalanine of m/z 462.2120 at 7.61 min, (C) MS2 spectrum of DON-tyrosine of m/z 478.2074 at 4.81 min, and (D) MS2 spectrum of DON-penicillin G of m/z 631 at 8.06 min.

