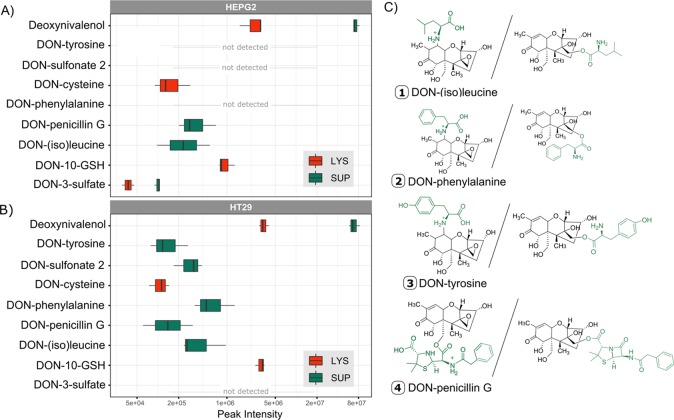
Figure 4.
Peak intensities of annotated DON metabolites. (A) Peak intensities of unlabeled DON-metabolites in supernatant (SUP, green) and lysate (LYS, red) of HepG2 (top). Except for DON-3-sulfate and DONS2, measurements of the positive mode are shown. The average of all three biological replicates with a maximum n = 3 is plotted. The metabolite had to be present in at least two out of the three replicates. A logarithmic scale was used for the x-axis (abundance). (B) Abundance of unlabeled DON-metabolites in supernatant (green) and lysate (red) of HT29 (bottom). Except for DON-3-sulfate and DONS2 measurements of the positive mode are shown. The average of all three biological replicates with a maximum n = 3 was taken. The metabolite had to be present in at least two out of the three replicates. A logarithmic scale was used for the x-axis (abundance). (C) Putative structures of amino acids and xenobiotic conjugates of DON with both possible structures. For DON-penicillin G conjugation can occur either after epoxide opening at C-13 or at C-15-OH and C-3-OH (not shown) after lactam opening. For DON amino acid adducts the options include conjugation after epoxide opening at C-13 or at C-10 by Michael addition.

