
Figure 3.
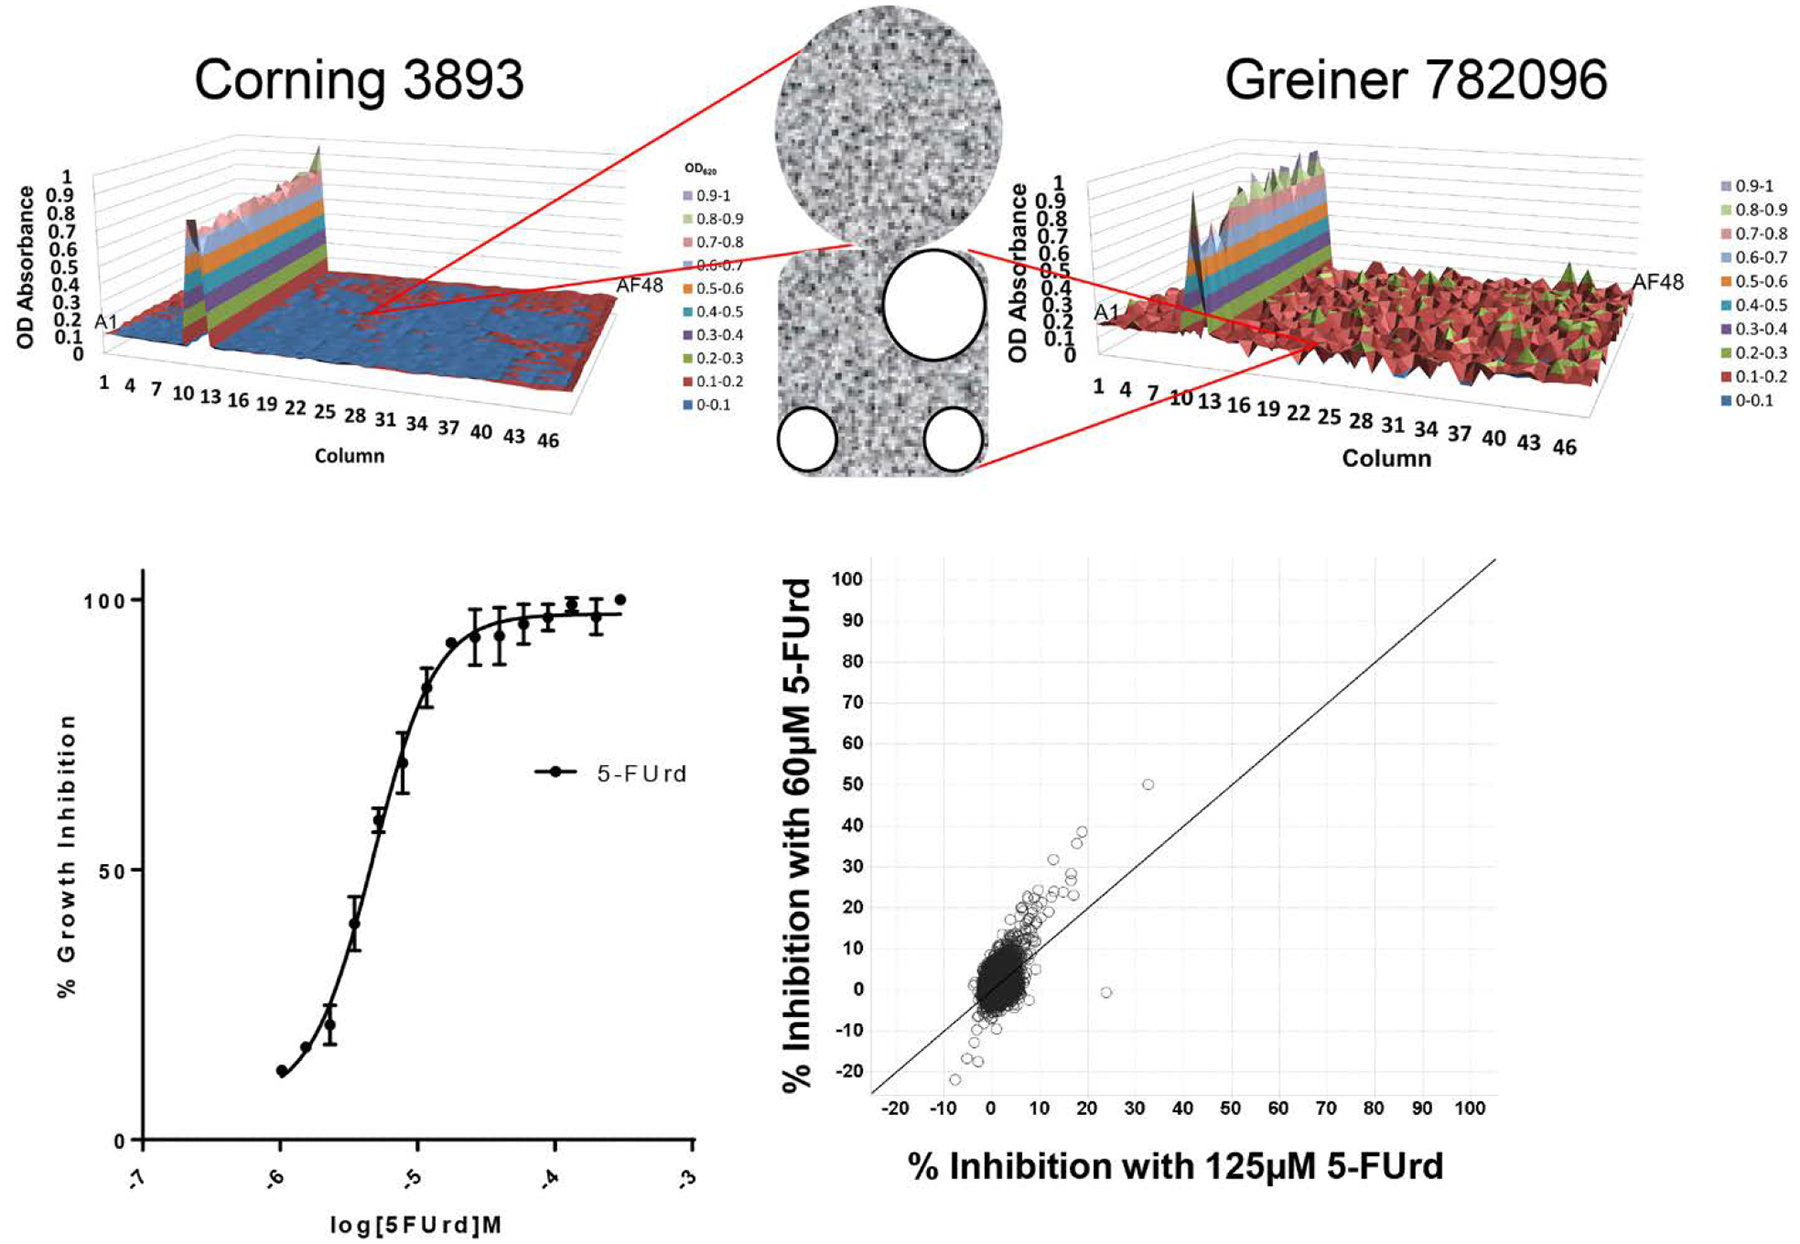
HTS assay optimization and validation. (A) Illustrates the effect of CO2 gas bubble formation in square well plates on background uniformity. X- and Y-axes indicate well coordinates and Z-axis indicates optical density (OD). Different colors indicate different level thresholds of positivity. Insert shows micrograph of gas bubbles (three round white circles) trapped in the corners of the square well from a Greiner 782096 plate and the lack of bubbles in the round well from the Corning 3893 plate. (B) Effect of 5-FUrd concentration on inhibition of PfENT1-expressing fui1Δ yeast growth. The IC50 for inhibition of yeast growth was 4.8 μM. (C) Averaged triplicate percent inhibition values for a 10 K validation compound set tested at 60 μM (y-axis) versus 125 μM (x-axis) 5-FUrd. Note that there was only 1 hit >30% inhibition at 125 μM 5-FUrd, while 60 μM 5-FUrd yielded 5 hits.